
When is a Recession not a Recession?
Many analysts consider two consecutive quarters of decline in real GDP to be a recession. But the latest US GDP numbers give conflicting signals.
Recessions are all about economic contractions – a fall in the rate of economic activity. Partly because of that, the single most popular indicator of recession is a fall in real GDP for at least two quarters in a row. On that basis, external page the latest numbers from the BEA may seem to indicate that the US economy has been in a recession all year: “headline” GDP shrank at an annual rate of 1.6% in 2022Q1 and 0.6% in Q2.
However, other indicators seem to tell a different story. Over the same period, external page inflation stayed high, the external page unemployment rate stayed low, while external page employment, external page personal consumption and external page corporate profits continued to grow. These conflicting signals complicate the Fed’s task of engineering a “soft landing” while reducing inflation, and in turn clouds the interest rate outlook for borrowers and investors. How could they make better sense of how the economy has been growing?
Part of the answer may be to look more carefully at the GDP figures. It’s understood that initial GDP figures are revised as more complete data arrives. For example, the -0.6% figure mentioned above for Q2 was revised from an initial estimate of -0.9%. Further revisions aren’t usually large enough to turn that into a positive value.1 Another type of measurement error in the GDP figures is larger, however, and receives much less attention; the difference between expenditure and income measures.
The basic principles of double-entry bookkeeping apply to GDP just as they do to a firm’s or a household’s Income Statements; every source of income is either spent or saved. That gives two different ways of measuring GDP: based on Expenditures or based on Income. “Headline” GDP is based on expenditures; it calculates GDP as the sum of expenditures on Personal Consumption, Private Investment, Net Exports and Government Spending (the Y = C+ I + G + NX from your first economics textbook.) But the BEA also estimates GDI (Gross Domestic Income), which includes Wages and Salaries, Corporate Profits, Investment Income, as well as some net transfers and taxes. If both GDI and GDP were correctly measured, they would give the same results. They are often close; for example, in 2019 GDI was estimated to be only 0.3% higher than GDP. Lately, however, the differences between the two have been larger, with GDI growing faster than GDP.2 The latest figures put 202202Q2 GDI 3.9% above GDP. As a result, while GDP shrank at an annual rate of 1.6% in 2022Q1 and 0.6% in Q2, GDI grew 1.8% in Q1 and 1.4% in Q2.3
So has the economy been growing or contracting? Which set of estimates should we believe? Part of the reason that “headline” GDP is based on the expenditure estimates is that the BEA (like most other national statistical agencies) has better measures of expenditures than of income.4 That doesn’t mean that the GDI estimates should be ignored, however. Since early work by external page Fixler and Nalewaik (2007) on the usefulness of GDI, several studies have tried to determine how much weight to assign to each of these two measures to best estimate “true” GDP growth. external page Aruoba et al. (2016) suggested that slightly more weight be put on GDI, leading the Federal Reserve Bank of Philadelphia to publish a combined estimate they call external page GDPplus. That estimate has stayed positive since 2020Q3 and is at 1.8% in 2022Q2 (i.e. higher than even GDI.) The BEA has taken to publishing the simple average of their GDP and GDI growth rates, which eked out 0.1% and 0.4% growth in Q1 and Q2.5

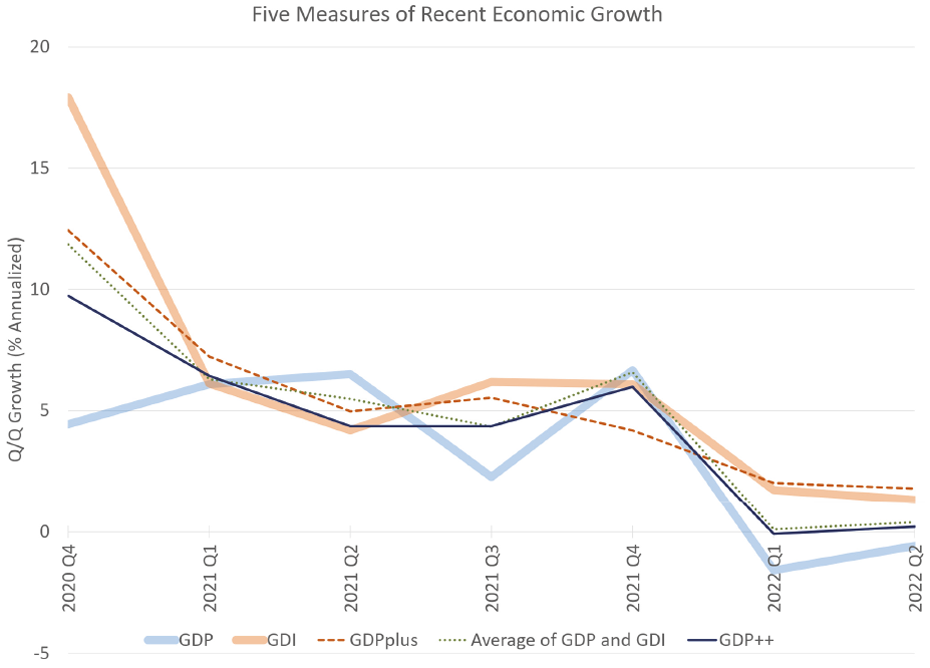
external page In a recent paper, we show how we can use the revisions in both GDP and GDI over time to help assess how informative each release of these series is and how we should weigh them accordingly. The resulting measure, which we call GDP++, tends to follow GDP growth a bit more closely than GDPplus. It also lets us put error bands around our estimates. The above graph compares these various growth measures. It shows that while they are all highly correlated, discrepancies of the size that we’ve seen in recent quarters tend to arise from time to time. The extreme movements during 2020 also highlight a distinctive feature of GDPplus; it produces a more persistent measure of growth and tends to smooth the COVID shock more than the other measures.6
The second graph shows the same series since 2020Q4. While the differences between the GDP and GDI estimates have grown since the end of 2021, they are still small when compared to the gap in 2020Q4. Until the start of 2022, external page GDPplus, GDP++ and the average of GDP & GDI gave very similar estimates, but now GDPplus is quite a bit higher than the others. GDP++ is estimated to be -0.1% in 2022Q1 and 0.2% in Q2, mirroring the estimates of nearly zero growth from the BEA’s average measure. Perhaps as important, however, is the statistical uncertainty around GDP++, with a 90% error band from -0.9 to 0.7% in Q1 and -0.6 to 0.9% in Q2. Put another way, while “headline” GDP would seem to indicate a (mild?) recession has begun, a closer look at its statistical uncertainty suggests that the data are also compatible with simply two quarters of weak but continuing growth.
1) For a deep dive into revisions in GDP, GDI and their components, see external page Fixler, de Francisco and Kanal (2021).
2) See external page here, Table 7, line 20.
3) See external page here, Table 1, lines 1 and 27.
4) Aonther reason is that GDI estimates become available only one to two months after the preliminary release of GDP.
5) See external page here, Table 1, line 28.
6) This may also account for it estimating growth in 2022Q2 to be higher than either the GDI or GDP estimates.
Contacts
KOF Konjunkturforschungsstelle
Leonhardstrasse 21
8092
Zürich
Switzerland
Director of KOF Swiss Economic Institute
Professur f. Wirtschaftsforschung
Leonhardstrasse 21
8092
Zürich
Switzerland