Global Economic Barometers: International Economy in Grip of the Coronavirus Epidemic
The two Global Economic Barometers show how much the coronavirus epidemic has already impacted the prospects for the global economy. Both the Leading Barometer for global economic development and the Coincident Barometer are declining sharply. These are the lowest values for both Barometers designed by KOF and FGV since 2009.
However, the considerable spread of the epidemic beyond the Asian region has not yet been taken into account in most input variables. Nevertheless, the Global Barometers show that the coronavirus epidemic is triggering shock waves for the global economy.
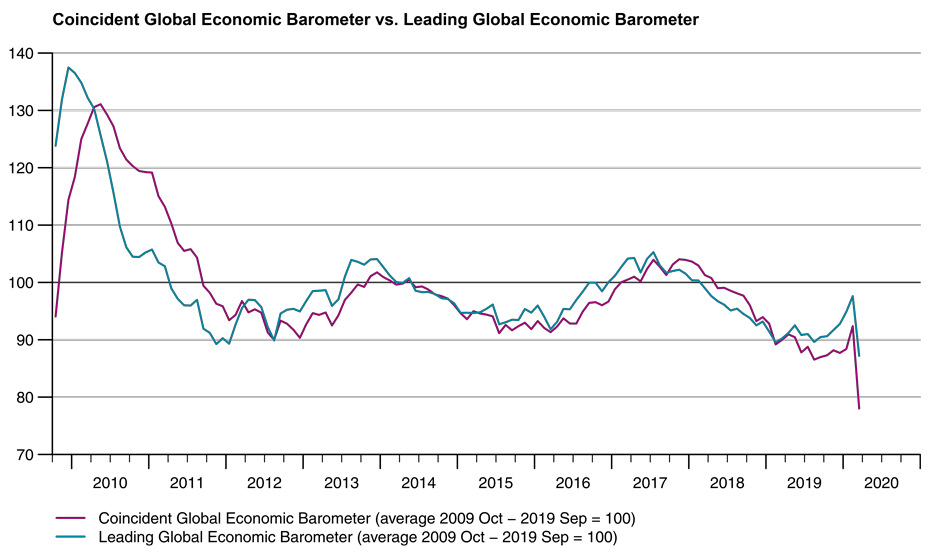
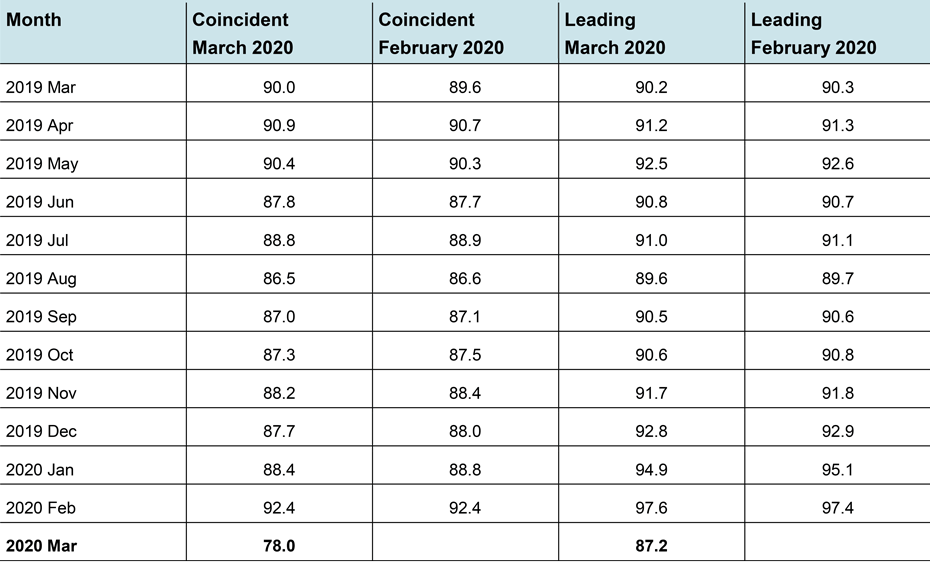
The Coincident Barometer drops by 14.4 points to 78.0 points (from 92.4 points in February), well below the long-term average of 100. The decline is due to the contribution of input variables that are summarized in the regional indicator bundle “Asia, Pacific and Africa”. The contribution of input variables from “Europe” and from the “Western Hemisphere” (North and Latin America as well as the Caribbean) is less negative than in the previous month.
However, most of the input variables do not yet include the spread of the epidemic beyond the Asian region. The decline in the Coincident Barometer suggests that the global economy has already suffered major damage. Viewed separately by economic sector, the contributions of the input variables for especially the industrial sector are much more negative than in the previous month. However, also the contribution of variables that reflect the overall economic development is clearly more negative. The contribution of input variables from the retail and wholesale trade sector is slightly more negative than in February. The change in contribution of input variables for the construction sector and the services sector was minor in March.
The Leading Barometer for the global economic development decreased by 10.4 points to 87.2 index points (from revised 97.6 points in February). On average, the Leading Barometer is three to six months ahead of the economic development. After indicating a tendency to improve in the first two months of this year, the economic prospects have now deteriorated considerably. As with the Coincident Barometer, this is due to the contribution of input variables from the geographical bundle “Asia, Pacific and Africa”.
The contribution of variables from “Europe” and the “Western Hemisphere” for the monthly change in the Leading Barometer is slightly positive. In case of the Global Leading Barometer the contributions of input variables from the “Industry” sector as well as input variables for overall economic development are particularly responsible for the decline, too. The contributions of the input variables for retail and wholesale trade are slightly more negative. The contributions from the construction sector and the service sector have hardly changed.
The full press release with table and graphs can be found Download here (PDF, 220 KB).
More information on the Global Economic Barometers can be found here.
The Global Economic Barometers
The Global Economic Barometers are a system of indicators that enables a timely analysis of global economic development. They represent a collaboration between the KOF Swiss Economic Institute of the ETH Zurich in Switzerland and Fundação Getulio Vargas (FGV) based in Rio de Janeiro, Brazil. The system consists of two composite indicators: a Coincident Barometer and a Leading Barometer. The Coincident Barometer reflects the current state of economic activity. The Leading Barometer, on the other hand, gives a cyclical signal that is roughly six months ahead of actual economic developments.
The two Barometers comprise the results of economic tendency surveys conducted in more than 50 countries. The aim is to achieve the broadest possible global coverage. Advantages of economic tendency surveys are that their results are usually available quickly and they are not substantially revised after the first publication.
The Coincident Barometer includes more than 1,000 different time series, while the Leading Barometer comprises over 600 time series. Cross-correlation analysis is used to decide which individual time series are included in the barometers. This involves correlating the individual time series with a reference series. The reference series used is the year-on-year growth rate of global gross domestic product (GDP), where the individual national GDPs are aggregated at purchasing power parity to form global GDP. A time series is only included in a Barometer if it shows a sufficiently high correlation and a suitable synchronisation or lead with the reference series.
The two Barometers are calculated once every month. They are usually published at the 10th of each calendar month. They are therefore available at a monthly frequency and in a timely manner.
The methodology is described in:
Download Klaus Abberger, Michael Graff, Aloisio Jr. Campelo, Anna Carolina Lemos Gouveia, Oliver Müller and Jan-Egbert Sturm (2020), The Global Economic Barometers: Composite indicators for the world economy. KOF Working Papers, vol. 471, Zurich: KOF Swiss Economic Institute, ETH Zurich, 2020.