Global Economic Barometers: The Crisis Deepens
The Coincident and Leading Barometers for the Global Economy for May demonstrate a deepening of the crisis caused by the Covid-19 pandemic. After the third and so far most significant of these three declines, the two indicators reached the lowest levels of their respective series since their beginning in 1991. This signals an unprecedented impact of the pandemic on World GDP for the second quarter of 2020.
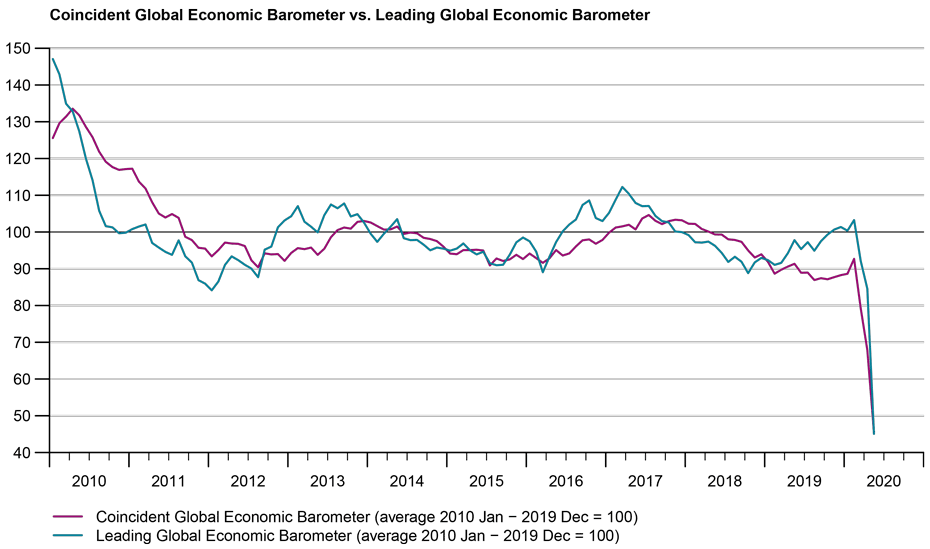
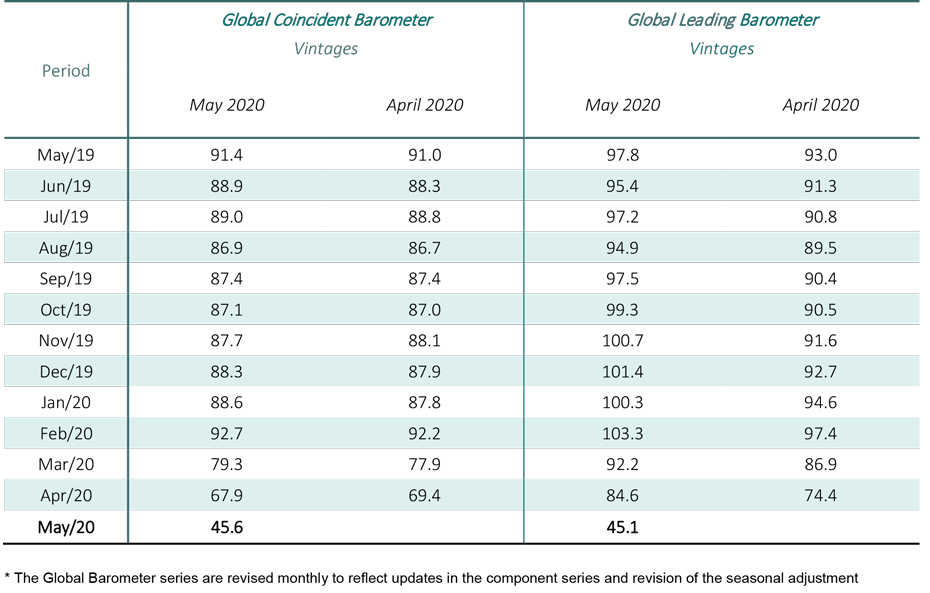
The Global Coincident Barometer falls by 22.3 points in May to 45.6 index points, compared to 67.9 points in the previous month. This is the lowest level since the beginning of the series in 1991 and 5.5 points below the previous historical low, which was reached in January 2009. The Global Leading Barometer recedes by 39.5 points, from 84.6 to 45.1 points, also reaching the lowest level of the series. It has now dropped 8.3 points below the previous low of January 2009. The drop in both indicators is spread across all continents and signals a retraction of the world economy at the beginning of the second quarter that already appears to be more serious than the crisis of 2008-2009.
“The development of the Global Barometers indicates a deepening of the crisis caused by COVID-19. This poses a major challenge not only for the entire global economy, but also for small, open economies like Switzerland,” says KOF Director Jan-Egbert Sturm. “The current standing of the indicators gives us an idea of the economic difficulties we will face in the coming months.”
Coincident Barometer – regions and sectors
In the three regions examined, this month's decrease in the Coincident Barometer is even stronger than that of the previous month. The Asia, Pacific, and Africa region, whose indicator had retreated less than the indicators of the other regions in April, return to recording an intense drop and exercising the largest contribution to the evolution of the indicator for the month. Europe provides the second largest contribution, followed by the Western Hemisphere (North America, Latin America, and the Caribbean). The graph below illustrates the contribution of each region to the deviation of the Coincident Barometer from the historical mean level of 100 points. Regarding sectors, the highest contribution to the drop comes from Industry, followed by the set of variables reflecting the aggregated evolution of economies (Overall Economic Development).
Leading Barometer – regions and sectors
The Global Leading Barometer leads the world economic growth rate cycle by three to six months. All the regions contribute to the fall of the indicator in May, especially Europe and the Western Hemisphere, followed by the Asia, Pacific, and Africa region, whose Leading Barometer returns to decline after a slight rise in the previous month. There is a strong decrease in the sectorial indicators, except in the Leading Barometer for Trade, which falls only slightly this month. Industry exerts the largest influence on the drop of the general indicator, followed by the variables linked to Overall Economic Development, Services, and Construction.
The full press release with table and graphs can be found Download here (PDF, 273 KB).
More information on the Global Economic Barometers can be found here.
The Global Economic Barometers
The Global Economic Barometers are a system of indicators that enables a timely analysis of global economic development. They represent a collaboration between the KOF Swiss Economic Institute of the ETH Zurich in Switzerland and Fundação Getulio Vargas (FGV) based in Rio de Janeiro, Brazil. The system consists of two composite indicators: a Coincident Barometer and a Leading Barometer. The Coincident Barometer reflects the current state of economic activity. The Leading Barometer, on the other hand, gives a cyclical signal that is roughly six months ahead of actual economic developments.
The two Barometers comprise the results of economic tendency surveys conducted in more than 50 countries. The aim is to achieve the broadest possible global coverage. Advantages of economic tendency surveys are that their results are usually available quickly and they are not substantially revised after the first publication.
The Coincident Barometer includes more than 1,000 different time series, while the Leading Barometer comprises over 600 time series. Cross-correlation analysis is used to decide which individual time series are included in the barometers. This involves correlating the individual time series with a reference series. The reference series used is the year-on-year growth rate of global gross domestic product (GDP), where the individual national GDPs are aggregated at purchasing power parity to form global GDP. A time series is only included in a Barometer if it shows a sufficiently high correlation and a suitable synchronisation or lead with the reference series.
The two Barometers are calculated once every month. They are usually published at the 10th of each calendar month. They are therefore available at a monthly frequency and in a timely manner.