Global Economic Barometers: Rise After Three Consecutive Declines
Following a succession of decreases that drove the Coincident and Leading Global Economic Barometers down to their lowest level in history last month, the indicators are showing the first signs of recuperation since the beginning of the Covid-19 pandemic. There remains a great uncertainty, but the modest movement of June may signal that the world economy is entering a phase of gradual recovery.
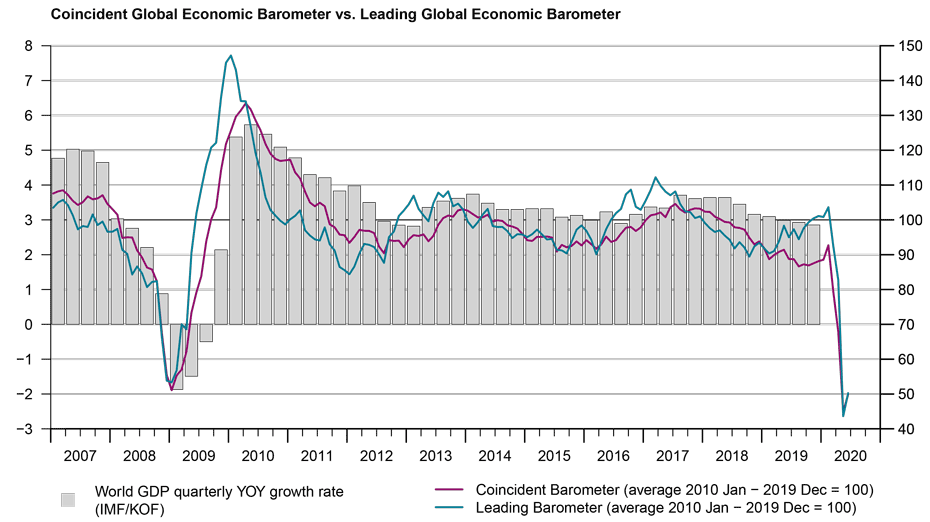
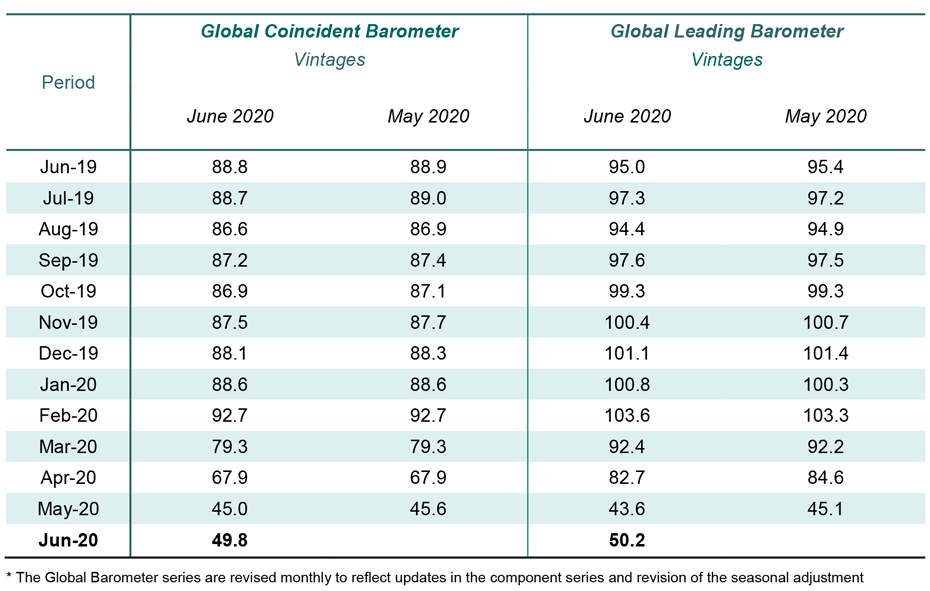
The Global Coincident Barometer has risen 4.8 points in June in comparison with the previous month, increasing from 45.0 to 49.8 points, the second lowest level since the series began in 1991. There has been a rise in the Asia, Pacific and Africa, and Europe regions but a further drop in the Coincident Barometer of the Western Hemisphere. The Global Leading Barometer has increased 6.6 points, from 43.6 to 50.2 points, also the second lowest level of the historical series, with the three regions examined showing improvement.
“The stabilisation of the Global Barometers signals that we might have reached the bottom of the trough. Most countries have started to ease the lockdown measures, but uncertainty about the development of the global economy remains high for the time being” summarises KOF director Jan-Egbert Sturm the results.
Coincident Barometer – regions and sectors
The 4.8 point increase in the Coincident Barometer represents a recovery of just 10% of the losses occurring between February and May. The major contributor to this month's increase is the Asia, Pacific, and Africa region, where the Coincident Barometer rose 8.7 points contributing 5.1 points to the rise in the Global Barometer. The second highest contribution of 0.6 of a point is provided by Europe whose Coincident Barometer increased by 2.9 points. The Western Hemisphere (North America, Latin America, and the Caribbean) contributes negatively to the result with 0.8 of a point after a regional decline of 3.3 points. The graph below illustrates the contribution of each region to the deviation of the Coincident Barometer from the historical mean level of 100 points.
Regarding sectors, the highest contribution to the increase in the Global Coincident Barometer for the month comes from Industry, followed by the set of variables reflecting the Overall Economic Development. The Services sector is the only area to continue receding this month.
Leading Barometer – regions and sectors
The Global Leading Barometer leads the world economic growth rate cycle by three to six months. All the regions contribute to the rise in the indicator in June, signalling a possible improvement for the future development. As in the case of the Coincident indicator, the stand-out region of the month is Asia, Pacific, and Africa, whose Leading Barometer rose 9.4 points contributing 5.6 points to the 6.6 point increase in the global indicator. Europe and the Western Hemisphere Leading Barometers rose 2.6 and 1.6 points contributing 0.6 and 0.4 of a point, respectively.
All sectors contribute positively to the result, with the exception of the variables connected to Overall Economic Development. Industry exerts the largest influence on the increase in the general indicator, followed by Services.
The full press release with table and graphs can be found Download here (PDF, 393 KB).
More information on the Global Economic Barometers can be found here.
The Global Economic Barometers
The Global Economic Barometers are a system of indicators that enables a timely analysis of global economic development. They represent a collaboration between the KOF Swiss Economic Institute of the ETH Zurich in Switzerland and Fundação Getulio Vargas (FGV) based in Rio de Janeiro, Brazil. The system consists of two composite indicators: a Coincident Barometer and a Leading Barometer. The Coincident Barometer reflects the current state of economic activity. The Leading Barometer, on the other hand, gives a cyclical signal that is roughly six months ahead of actual economic developments.
The two Barometers comprise the results of economic tendency surveys conducted in more than 50 countries. The aim is to achieve the broadest possible global coverage. Advantages of economic tendency surveys are that their results are usually available quickly and they are not substantially revised after the first publication.
The Coincident Barometer includes more than 1,000 different time series, while the Leading Barometer comprises over 600 time series. Cross-correlation analysis is used to decide which individual time series are included in the barometers. This involves correlating the individual time series with a reference series. The reference series used is the year-on-year growth rate of global gross domestic product (GDP), where the individual national GDPs are aggregated at purchasing power parity to form global GDP. A time series is only included in a Barometer if it shows a sufficiently high correlation and a suitable synchronisation or lead with the reference series.
The two Barometers are calculated once every month. They are usually published at the 10th of each calendar month. They are therefore available at a monthly frequency and in a timely manner.