Global Economic Barometers Continue to Rebound
The Coincident and Leading Global Economic Barometers are rising in August, sustaining the tendency towards a world economic rebound. While the Coincident Barometer continues to gradually move away from the trough of the crisis, the Leading Barometer has advanced faster, signalling confidence for the recovery of world GDP in the coming months. This result should be interpreted cautiously given the high degree of uncertainty on both the economic and health fronts.
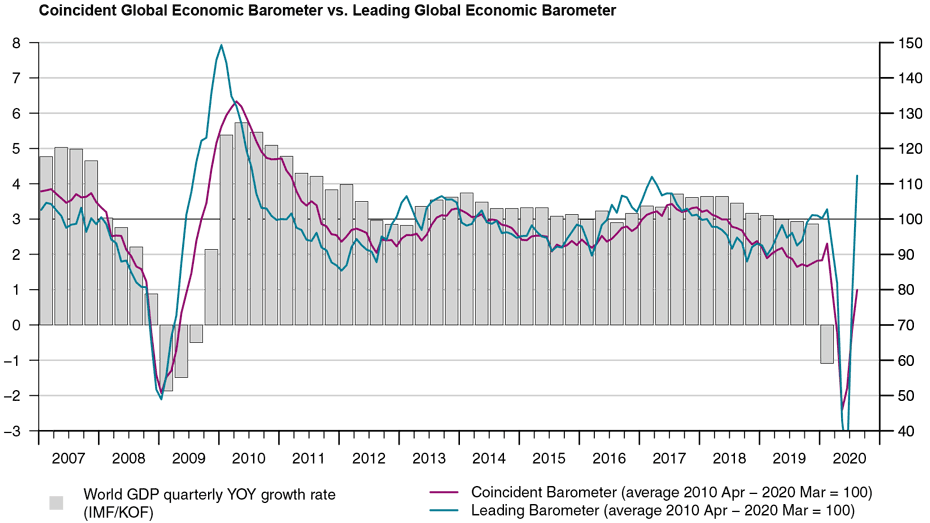
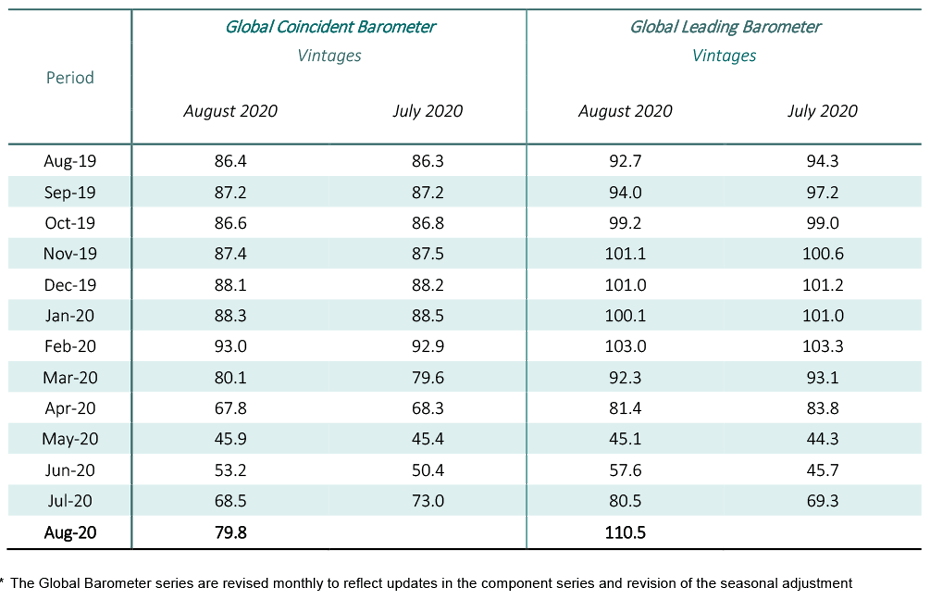
The Global Coincident Barometer is rising 11.3 points in August relative to the previous month, increasing from 68.5 to 79.8 points. The Global Leading Barometer, meanwhile, climbes to 29.9 points, from 80.5 to 110.5 points. All three broader regions investigated contribute positively to this result, with the Asia, Pacific and Africa region leading the movement in the Coincident Barometer and all three regions contributing similarly to the development of the Leading Barometer.
“The solidified rise in the Global Barometer shows that the worldwide economic stimulus measures and the easing after the lockdowns are beginning to have an impact on the global economic development. If we want to continue along this path, it is important to monitor infection rates closely, so that we can react as quickly as possible with countermeasures, but also to continue to support the economy” comments KOF Director Jan-Egbert Sturm the latest results of the Global Barometers.
Coincident Barometer – regions and sectors
The Asia, Pacific and Africa region is responsible for over 50 percent of the advance in the Coincident Barometer in August, contributing 6.4 points to the increase of 11.3 points. The Western Hemisphere (North America, Latin America and the Caribbean) reduces the intensity of the increase seen in the previous month and contributed 2.1 points to the global indicators. Europe, in turn, contributes 2.8 points. The graph below illustrates the contribution of each region to the deviation of the Coincident Barometer from the historical mean level of 100 points.
All sectors continue to evolve positively in August. The largest contributions to the increase in the Coincident Global Barometer once again comes from Industry, followed by the set of variables reflecting the aggregated evolution of economies (Overall Economic Development). The Services, Trade, and Construction sectors continued moderately contributing modestly to the development.
Leading Barometer – regions and sectors
The Leading Global Barometer leads the world economic growth rate cycle by three to six months on average. In August, the regional contributions from Asia, Pacific and Africa (13.5 points) and Europe (11.9 points) to the 29.9 point rise in the global indicator were stronger than in the previous month. The contribution of the Western Hemisphere, of 4.6 points, was inferior to the 6.2 points it contributed in July.
All sector indicators continue to contribute positively to the result, with Industry and the set of variables that reflect the aggregated development of economies (Overall Economic Development) exerting 80 percent of the change in the Leading Barometer. The remaining sectors contributed less significantly to the increase in the global leading indicator.
The full press release with table and graphs can be found Download here (PDF, 548 KB).
More information on the Global Economic Barometers can be found here.
The Global Economic Barometers
The Global Economic Barometers are a system of indicators that enables a timely analysis of global economic development. They represent a collaboration between the KOF Swiss Economic Institute of the ETH Zurich in Switzerland and Fundação Getulio Vargas (FGV) based in Rio de Janeiro, Brazil. The system consists of two composite indicators: a Coincident Barometer and a Leading Barometer. The Coincident Barometer reflects the current state of economic activity. The Leading Barometer, on the other hand, gives a cyclical signal that is roughly six months ahead of actual economic developments.
The two Barometers comprise the results of economic tendency surveys conducted in more than 50 countries. The aim is to achieve the broadest possible global coverage. Advantages of economic tendency surveys are that their results are usually available quickly and they are not substantially revised after the first publication.
The Coincident Barometer includes more than 1,000 different time series, while the Leading Barometer comprises over 600 time series. Cross-correlation analysis is used to decide which individual time series are included in the barometers. This involves correlating the individual time series with a reference series. The reference series used is the year-on-year growth rate of global gross domestic product (GDP), where the individual national GDPs are aggregated at purchasing power parity to form global GDP. A time series is only included in a Barometer if it shows a sufficiently high correlation and a suitable synchronisation or lead with the reference series.
The two Barometers are calculated once every month. They are usually published at the 10th of each calendar month. They are therefore available at a monthly frequency and in a timely manner.