Global Barometers remain at a high level but move in opposite directions
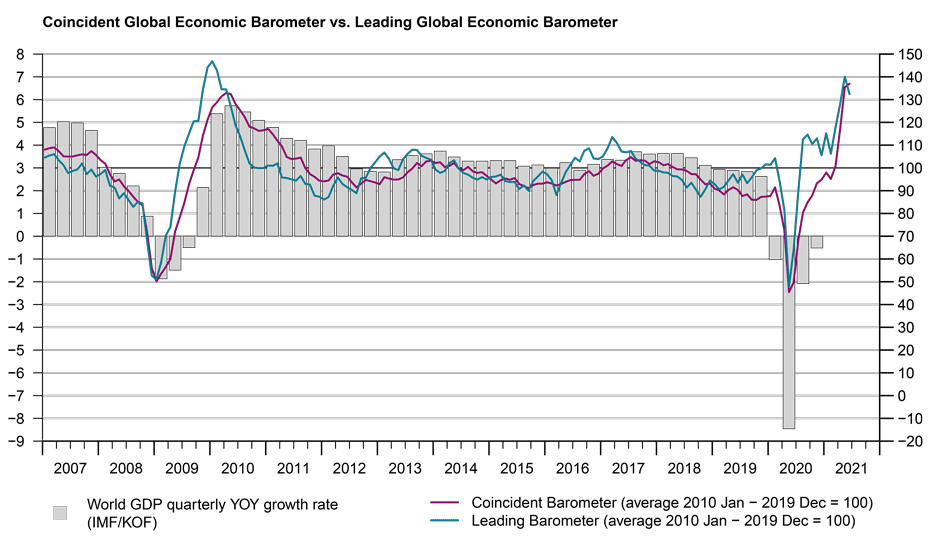
The Coincident Global Barometer keeps the upward tendency and reaches its highest historical level in June. Moving in the opposite direction the Leading Barometer decreases, but after having risen markedly in the three previous months.
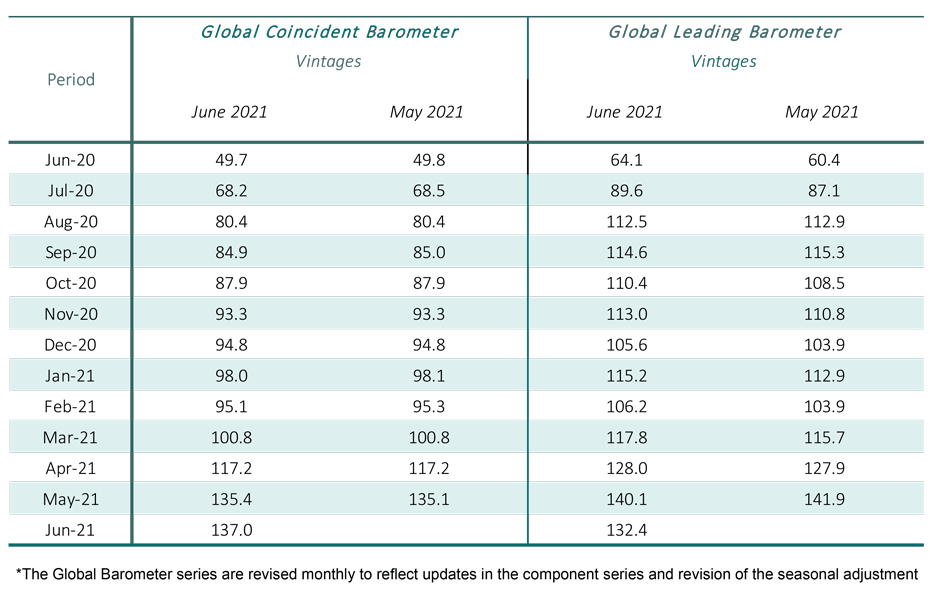
The Coincident Global Barometer rises by 1.6 points in June, to 137.0 points, the highest level since the series started in 1991. The Leading Global Barometer decreases by 7.7 points, to 132.4 points. All the analysed regions develop positively in the Coincident Barometer, while all regions decline in the Leading Barometer.
“Albeit remaining buoyant, the leading barometer has reduced in value. With both indicators still showing levels more than three standard deviations above normal, the global economy is in strong recovery mode. The ongoing vaccination campaign is also increasingly reflected in the strong positive signals we are getting from the services sector, the sector where personal contacts play a dominant role”, evaluates Jan-Egbert Sturm, Director of KOF Swiss Economic Institute.
Coincident Barometer – regions and sectors
The Asia, Pacific and Africa region make the strongest contribution to the rise in the Coincident Global Barometer, with 1.0 points, followed by Europe and the Western Hemisphere, with 0.4 and 0.2 points, respectively. Assessments of the current situation continue to improve in all the regions, presumably influenced by the acceleration in the level of activity as populations are being vaccinated. Regional indicators in the Western Hemisphere and Europe have reached an all-time high and the one for the Asia, Pacific and Africa region have hit a new peak since 2010. The graph below illustrates the contribution of each region to the deviation of the Coincident Barometer from the historical average of 100 points.
Of the five sectors, three contribute positively to the aggregate result of the Coincident Barometer. After the markedly increase of the previous months, the indicators that measures the Services and Construction sectors and the aggregated development of economies (Overall Economic Development) climb moderately, while Industry and Trade sectors register a slight decrease for the month. All the indicators are above a level of 125 points, with the Services sector and the indicator that measures the aggregated development of economies Overall Economic Development) reaching their highest levels of the series with 152.9 and 140.6 points, respectively.
Leading Barometer – regions and sectors
The Leading Global Barometer leads the world economic growth rate cycle by three to six months on average. The leading indicators of all the three regions contribute negatively to the result of the Leading Global Barometer in June. The Western Hemisphere makes the strongest contribution to the fall, decreasing 3.3 points, followed by the Asia, Pacific and Africa region, with -3.0 points, and Europe with, -1.4 points.
All leading sectoral indicator bundles decrease in June, after strong increases in the previous months. Even with the fall this month, almost all the sectors record levels above 130 points. Whit 124.1 points, the only exception is the indicator that measures the aggregated development of economies (Overall Economic Development). The level of the indicators continues to reflect a highly optimistic outlook in relation to the near future. The strongest contribution to this month’s fall came from Industry, followed by Services and Trade. The remaining sectors contribute with less than 1.0 point to the aggregate result.
The full press release with tables and graphs can be found Download here (PDF, 537 KB).
More information on the Global Economic Barometers can be found here.
The Global Economic Barometers
The Global Economic Barometers are a system of indicators enabling timely analysis of global economic development. They represent a collaboration between the KOF Swiss Economic Institute of the ETH Zurich in Switzerland and Fundação Getulio Vargas (FGV), based in Rio de Janeiro, Brazil. The system consists of two composite indicators, the Coincident Barometer and the Leading Barometer. The Coincident Barometer reflects the current state of economic activity, while the Leading Barometer provides a cyclical signal roughly six months ahead of current economic developments.
The two Barometers comprise the results of economic tendency surveys conducted in more than 50 countries with the aim of achieving the broadest possible global coverage. The advantages of economic tendency surveys are that their results are usually readily available and are not substantially revised after first publication.
The Coincident Barometer includes more than 1,000 different time series, while the Leading Barometer consists of over 600 time series. Cross-correlation analysis is used to decide which individual time series are included in the barometers. This involves correlating the individual time series with a reference series. The reference series used is the year-on-year growth rate of global gross domestic product (GDP), where the individual national GDPs are aggregated at purchasing power parity to form global GDP. A time series is only included in a Barometer if it shows a sufficiently high correlation and a suitable synchronization or lead with the reference series. The time period used for this correlation analysis currently runs from January 2010 to December 2019.
The series of the two Barometers are revised each month at publication and are standardized to have a mean of 100 and a standard deviation of 10 for the 10-year period previous to the most recent observations.
The methodology is described in:
Klaus Abberger, Michael Graff, Aloisio Jr. Campelo, Anna Carolina Lemos Gouveia, Oliver Müller and Jan-Egbert Sturm (2020), The Global Economic Barometers: Composite indicators for the world economy. KOF Working Papers, vol. 471, Zurich: KOF Swiss Economic Institute, ETH Zurich, 2020.