Global Barometers: Downward corrections at high levels
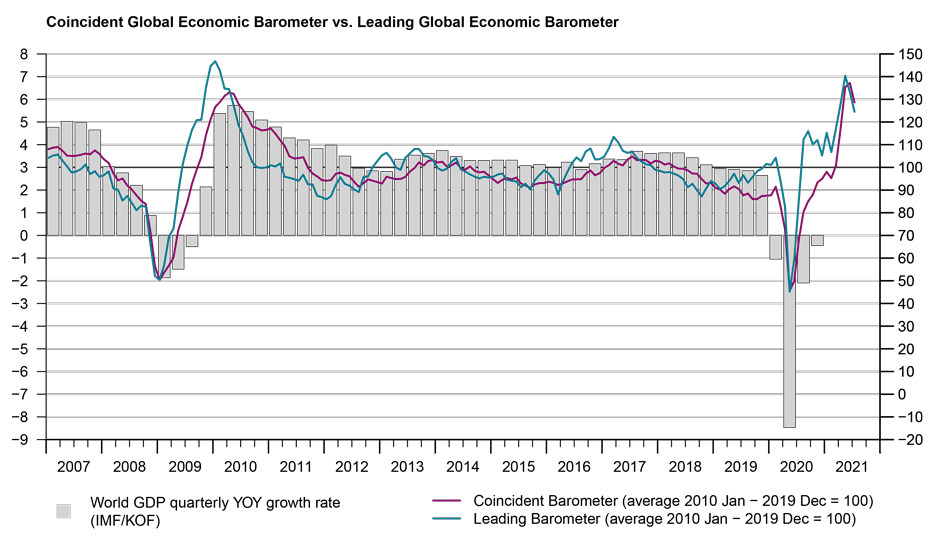
The Global Economic Barometers fell in July, following the tendency already indicated by the Leading Global Barometer in the previous month. Despite the monthly downward development, both indicators remain at high levels, compatible with the continued phase of recovery of global economic activity in 2021. However, the current and future perspectives in the three investigated regions have cooled somewhat.
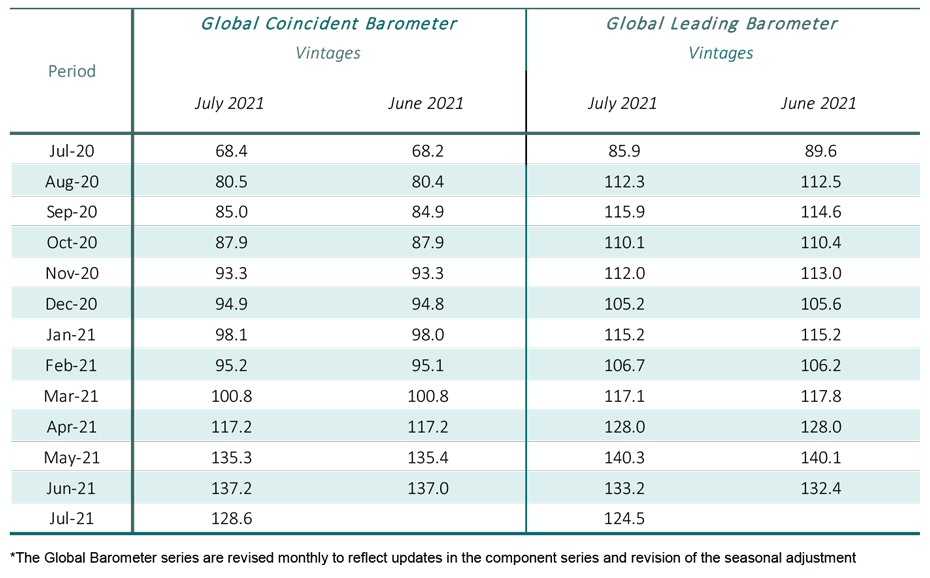
The Coincident Global Barometer decreases by 8.6 points in July to 128.6 points, after an accumulated increase of 42 points between March and June. The Leading Global Barometer falls 8.7 points, to 124.5 points. All investigated regions developed negatively in July.
“For the second month in a row, we see a decline in the leading barometer. This time, the coincident indicator also lost some ground. Temporary difficulties in getting supply chains back in order, but above all the rising fears of possibly re-emerging infections caused by variants of concerns, are downers on the otherwise still strong recovery of the global economy. Immunisation through vaccination seems to be the best remedy here – also for the economy.” concludes KOF-Director Jan-Egbert Sturm.
Coincident Barometer – regions and sectors
The Western Hemisphere is the region that made the strongest contribution to the fall in the Coincident Global Barometer, with 4.2 points, followed by Asia, Pacific and Africa and Europe, with 3.3 and 1.1 points, respectively. The first decrease in the regional indicators since last February can be interpreted as a deceleration in the rate of inter-annual growth of the global economy at the beginning of the third quarter of 2021. The graph below illustrates the contribution of each region to the deviation of the Coincident Barometer from the historical average of 100 points.
All five of the studied sectors contribute negatively to the aggregate result of the Coincident Barometer in July. The indicator for the Services sector and the indicator that measures the aggregated development of economies (Economy) decrease 13.1 points and 10.6 points, respectively, although they continue to record the highest levels as compared to the other sectors. The other sectors contribute more moderately to the result. Despite the fall, all the coincident sectoral indicators remain above 120 points, i.e. two standard deviations above their long-run averages.
Leading Barometer – regions and sectors
The Leading Global Barometer aims to lead the world economic growth rate cycle by three to six months on average. The leading indicators of the three regions contribute negatively to the result of the Leading Barometer in July. The Western Hemisphere makes the strongest contribution to the decline (-3.9 points) followed by the Asia, Pacific and Africa region, with -3.5 points, and Europe, with -1.3 points.
With the exception of the indicator for the Construction sector, which increases 0.1 points, all leading sectoral indicator bundles decrease in July. For the second consecutive month, the strongest contribution to the decline this month comes from Industry. Despite the retraction, the level of the indicators continues to reflect optimism, with Construction, the Services sector, and Trade indicators remaining above 130 points, i.e. three standard deviation above their long-run averages.
The full press release with tables and graphs can be found Download here (PDF, 543 KB).
More information on the Global Economic Barometers can be found here.
The Global Economic Barometers
The Global Economic Barometers are a system of indicators enabling timely analysis of global economic development. They represent a collaboration between the KOF Swiss Economic Institute of the ETH Zurich in Switzerland and Fundação Getulio Vargas (FGV), based in Rio de Janeiro, Brazil. The system consists of two composite indicators, the Coincident Barometer and the Leading Barometer. The Coincident Barometer reflects the current state of economic activity, while the Leading Barometer provides a cyclical signal roughly six months ahead of current economic developments.
The two Barometers comprise the results of economic tendency surveys conducted in more than 50 countries with the aim of achieving the broadest possible global coverage. The advantages of economic tendency surveys are that their results are usually readily available and are not substantially revised after first publication.
The Coincident Barometer includes more than 1,000 different time series, while the Leading Barometer consists of over 600 time series. Cross-correlation analysis is used to decide which individual time series are included in the barometers. This involves correlating the individual time series with a reference series. The reference series used is the year-on-year growth rate of global gross domestic product (GDP), where the individual national GDPs are aggregated at purchasing power parity to form global GDP. A time series is only included in a Barometer if it shows a sufficiently high correlation and a suitable synchronization or lead with the reference series. The time period used for this correlation analysis currently runs from January 2010 to December 2019.
The series of the two Barometers are revised each month at publication and are standardized to have a mean of 100 and a standard deviation of 10 for the 10-year period previous to the most recent observations.
The methodology is described in:
Klaus Abberger, Michael Graff, Aloisio Jr. Campelo, Anna Carolina Lemos Gouveia, Oliver Müller and Jan-Egbert Sturm (2020), The Global Economic Barometers: Composite indicators for the world economy. KOF Working Papers, vol. 471, Zurich: KOF Swiss Economic Institute, ETH Zurich, 2020.
Contact
KOF Konjunkturforschungsstelle
Leonhardstrasse 21
8092
Zürich
Switzerland