Global barometers remain high but signal slower expansion in the third quarter
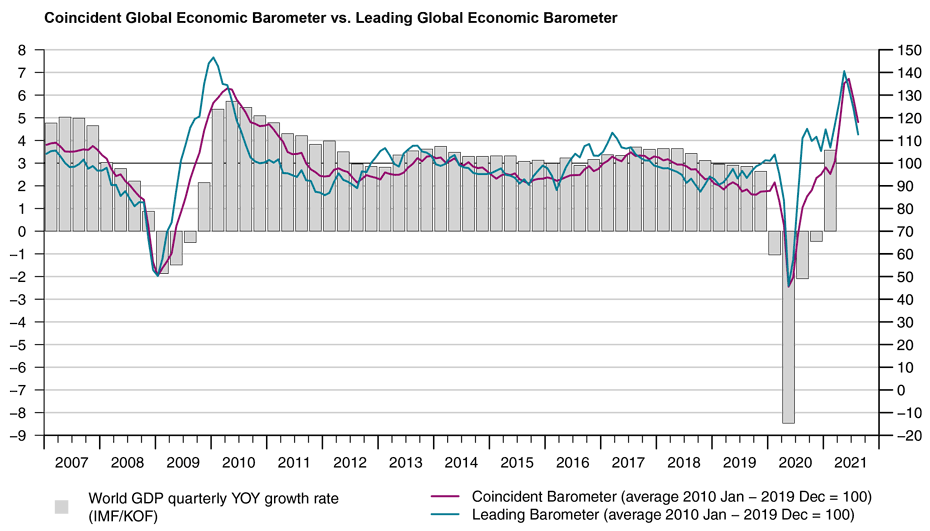
The fall in the Global Economic Barometers in August indicates a slowdown in world economic growth rates for the second half of 2021. Despite their decline, the indicators remain at a high level consistent with the continuation of the current recovery phase in global economic activity.
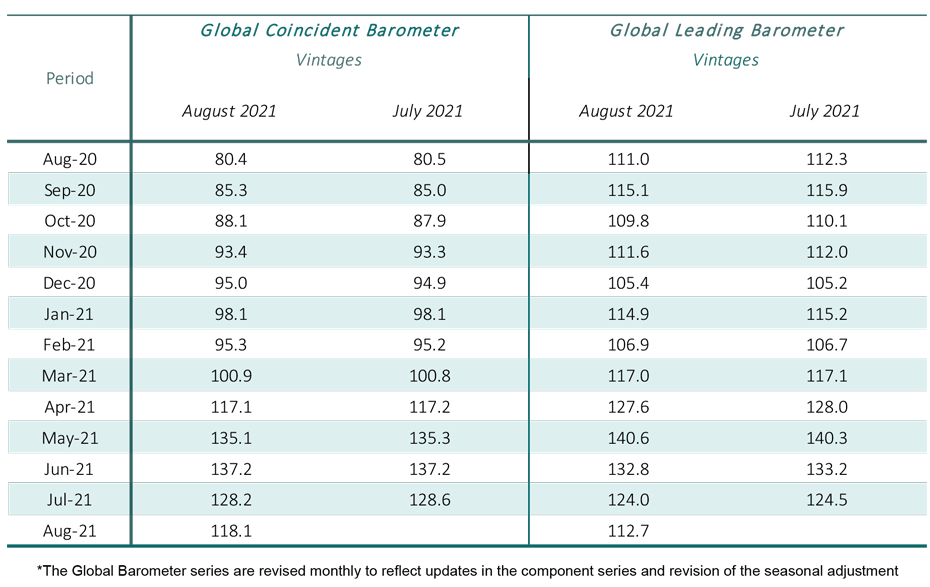
The Coincident Global Barometer decreases by 10.1 points in August to 118.1 points. The Leading Global Barometer falls 11.3 points, to 112.7 points. All investigated regions developed negatively in August, with more severe losses in the Asia, Pacific and Africa region for both indicators.
“The second and third months of declines in the coincident and leading indicators, respectively, suggest that the initial strong upswing and normalization phase will soon be over and that the global economy is moving toward more sustainable, albeit still high, growth rates. Although variants of concern have probably accelerated this process, we must note that the economy has learned to cope much better with the pandemic and the associated restrictions on social behaviour than was thought possible last year”, evaluates KOF-Director Jan-Egbert Sturm.
Coincident Barometer – regions and sectors
The Asia, Pacific and Africa region provides the strongest contribution to the fall in the Coincident Global Barometer, with 6.3 points, followed by the Western Hemisphere, with 2.0 points, and Europe, with 1.8 points. The result mostly reflects the inherent deceleration of year-on-year growth rates in world GDP as the economy moves away from the base period of the second quarter of 2020. All regions continue to record indicators above the historical level of 100 points, indicating a favourable economic situation. The graph below illustrates the contribution of each region to the deviation of the Coincident Barometer from 100 points.
All five of the studied sectors contribute negatively to the development of the Coincident Barometer in August. The indicators that measure the aggregated development of economies (Economy) and Industry make the strongest contributions to the fall this month, despite remaining at high levels. The indicator for the Services sector decreases markedly for the second consecutive month but continues to record the highest level among the sectors. It is possible that the difficulty controlling new coronavirus variants is hampering a sustainable return in this sector.
Leading Barometer – regions and sectors
The Leading Global Barometer leads the world economic growth rate cycle by three to six months on average. The leading indicators of the three regions contribute negatively to the development of the Leading Barometer in August. The Asia, Pacific and Africa region contribute 7.8 points to the fall, the Western Hemisphere 1.9 points, and Europe 1.6 points. The slowing of the exceptionally strong pace of expansion is therefore likely to continue in the months ahead.
All leading sectoral indicators fall in August, with Industry standing out, being the sector that had dominated recovery of the world economy up to the beginning of 2021. Despite the decreases, the Services, Construction, and Trade sectors continue to record levels that reflect short-term optimism.
The full press release with tables and graphs can be found Download here. (PDF, 544 KB)
More information on the Global Economic Barometers can be found here.
The Global Economic Barometers
The Global Economic Barometers are a system of indicators enabling timely analysis of global economic development. They represent a collaboration between the KOF Swiss Economic Institute of the ETH Zurich in Switzerland and Fundação Getulio Vargas (FGV), based in Rio de Janeiro, Brazil. The system consists of two composite indicators, the Coincident Barometer and the Leading Barometer. The Coincident Barometer reflects the current state of economic activity, while the Leading Barometer provides a cyclical signal roughly six months ahead of current economic developments.
The two Barometers comprise the results of economic tendency surveys conducted in more than 50 countries with the aim of achieving the broadest possible global coverage. The advantages of economic tendency surveys are that their results are usually readily available and are not substantially revised after first publication.
The Coincident Barometer includes more than 1,000 different time series, while the Leading Barometer consists of over 600 time series. Cross-correlation analysis is used to decide which individual time series are included in the barometers. This involves correlating the individual time series with a reference series. The reference series used is the year-on-year growth rate of global gross domestic product (GDP), where the individual national GDPs are aggregated at purchasing power parity to form global GDP. A time series is only included in a Barometer if it shows a sufficiently high correlation and a suitable synchronization or lead with the reference series. The time period used for this correlation analysis currently runs from January 2010 to December 2019.
The series of the two Barometers are revised each month at publication and are standardized to have a mean of 100 and a standard deviation of 10 for the 10-year period previous to the most recent observations.
The methodology is described in:
Klaus Abberger, Michael Graff, Aloisio Jr. Campelo, Anna Carolina Lemos Gouveia, Oliver Müller and Jan-Egbert Sturm (2020), The Global Economic Barometers: Composite indicators for the world economy. KOF Working Papers, vol. 471, Zurich: KOF Swiss Economic Institute, ETH Zurich, 2020.
Contact
KOF Konjunkturforschungsstelle
Leonhardstrasse 21
8092
Zürich
Switzerland