Global Barometers continue to decline
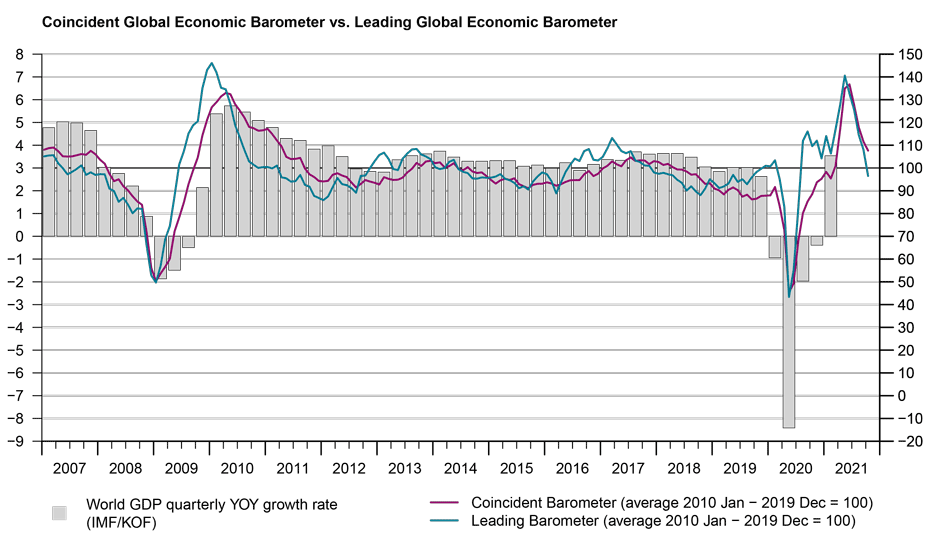
In October, the Global Economic Barometers maintain the weakening tendency that started in July, reflecting the slowdown in World economic growth in the second half of 2021. The more intense fall of the Leading Barometer suggests a possible intensification of this tendency in the next three to six months.
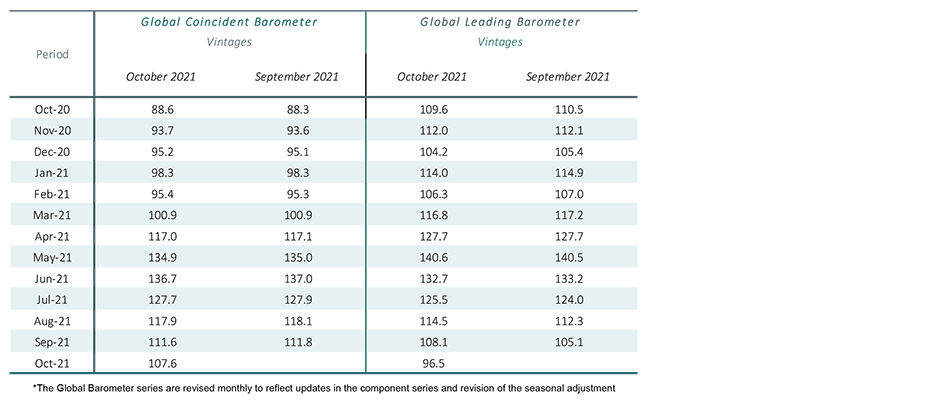
The Coincident Global Barometer decreases by 4.0 points in October to 107.6 points. The Leading Global Barometer falls 11.6 points, to 96.5 points, the lowest level since July 2020 (82.1 points). All examined regions develop negatively in October, with greater declines in the Asia, Pacific and Africa region for the Coincident Barometer and the Leading Barometer.
“Even though current dynamics remain above average across all sectors and regions, the outlook for the coming quarters has generally become clearly gloomier. In particular, but not only, in Asia the mood is changing and the global economy seems to be entering a cooling phase after the strong recoveries of the recent past.”, evaluates Jan-Egbert Sturm, director of KOF Swiss Economic Institute.
Coincident Barometer – regions and sectors
All regions contribute negatively to the aggregate result in October, with the Asia, Pacific and Africa region standing out with a contribution of 2.1 points (53%) to the fall in the Coincident Global Barometer. The Western Hemisphere and Europe make negative contributions of 1.1 and 0.8 points, respectively. All regions continue to record indicators above the historical level of 100 points. The graph below illustrates the contribution of each region to the deviation of the Coincident Barometer from the historical average of 100 points.
Indicators for four of the five studied sectors decrease in October. The largest fall comes from the indicator for the Services sector, which, after its fourth consecutive decline, now records the lowest level among the sectors, after having recorded the highest level between May and September. In October, the highest level among the sectoral indicators is that of Industry, although the difference between the five sector indicators is small, with all of them recording levels between 104 and 109 points.
Leading Barometer – regions and sectors
The Leading Global Barometer leads the world economic growth rate cycle by three to six months on average. The leading indicators of the three regions contribute negatively to the result of the Leading Barometer in October. The Asia, Pacific and Africa region makes the strongest contribution to the fall, with 5.5 points, followed by Europe and the Western Hemisphere with negative contributions of 3.4 and 2.7 points, respectively. This is the first time that all regions record levels below the long-run average of 100 points since July 2020.
There is a fall in all leading sectoral indicators in October, with the 28-point drop in the Services sector standing out; although this sector had been the most optimistic until the previous month, it closes October below the neutral level of 100 points, at 94.1 points. With this month’s decrease, the indicator that measures the general state of the Economy (aggregated development of economies) records 89.7 points, the lowest level since July 2020 (80.3 points). Only the Construction and Trade sectors continue to record levels that reflect short-term optimism.
The full press release with tables and graphs can be found Download here (PDF, 553 KB).
More information on the Global Economic Barometers can be found here.
The Global Economic Barometers
The Global Economic Barometers are a system of indicators enabling timely analysis of global economic development. They represent a collaboration between the KOF Swiss Economic Institute of the ETH Zurich in Switzerland and Fundação Getulio Vargas (FGV), based in Rio de Janeiro, Brazil. The system consists of two composite indicators, the Coincident Barometer and the Leading Barometer. The Coincident Barometer reflects the current state of economic activity, while the Leading Barometer provides a cyclical signal roughly six months ahead of current economic developments.
The two Barometers comprise the results of economic tendency surveys conducted in more than 50 countries with the aim of achieving the broadest possible global coverage. The advantages of economic tendency surveys are that their results are usually readily available and are not substantially revised after first publication.
The Coincident Barometer includes more than 1,000 different time series, while the Leading Barometer consists of over 600 time series. Cross-correlation analysis is used to decide which individual time series are included in the barometers. This involves correlating the individual time series with a reference series. The reference series used is the year-on-year growth rate of global gross domestic product (GDP), where the individual national GDPs are aggregated at purchasing power parity to form global GDP. A time series is only included in a Barometer if it shows a sufficiently high correlation and a suitable synchronization or lead with the reference series. The time period used for this correlation analysis currently runs from January 2010 to December 2019.
The series of the two Barometers are revised each month at publication and are standardized to have a mean of 100 and a standard deviation of 10 for the 10-year period previous to the most recent observations.
The methodology is described in:
Klaus Abberger, Michael Graff, Aloisio Jr. Campelo, Anna Carolina Lemos Gouveia, Oliver Müller and Jan-Egbert Sturm (2020), The Global Economic Barometers: Composite indicators for the world economy. KOF Working Papers, vol. 471, Zurich: KOF Swiss Economic Institute, ETH Zurich, 2020.
Contact
KOF Konjunkturforschungsstelle
Leonhardstrasse 21
8092
Zürich
Switzerland