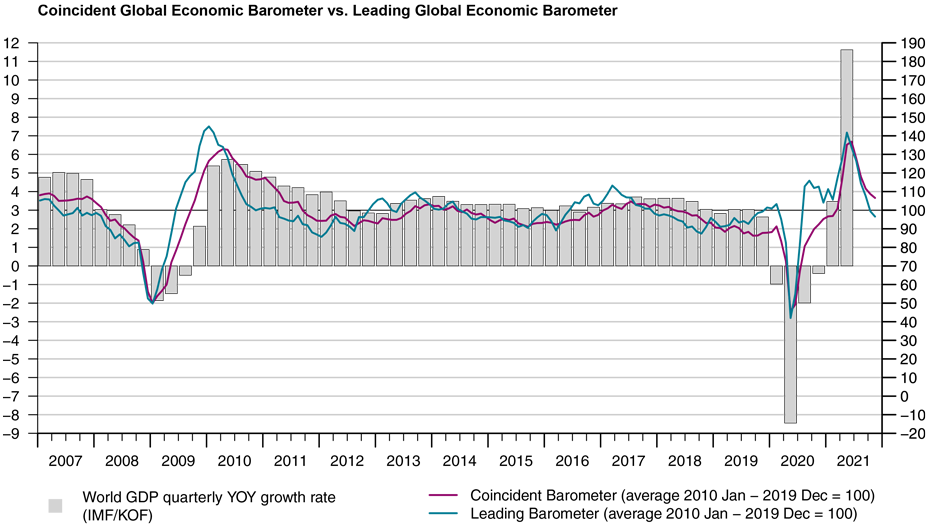
Global Barometers fall again, signalling a further moderation of the global economic recovery
The Global Economic Barometers declined once again in November, continuing the weakening that started in the third quarter. Despite falling in all regions, the Coincident Barometer remains above 100 points. However, the Leading Barometer remains below 100 for a second consecutive month, albeit with a less pronounced decline in November.
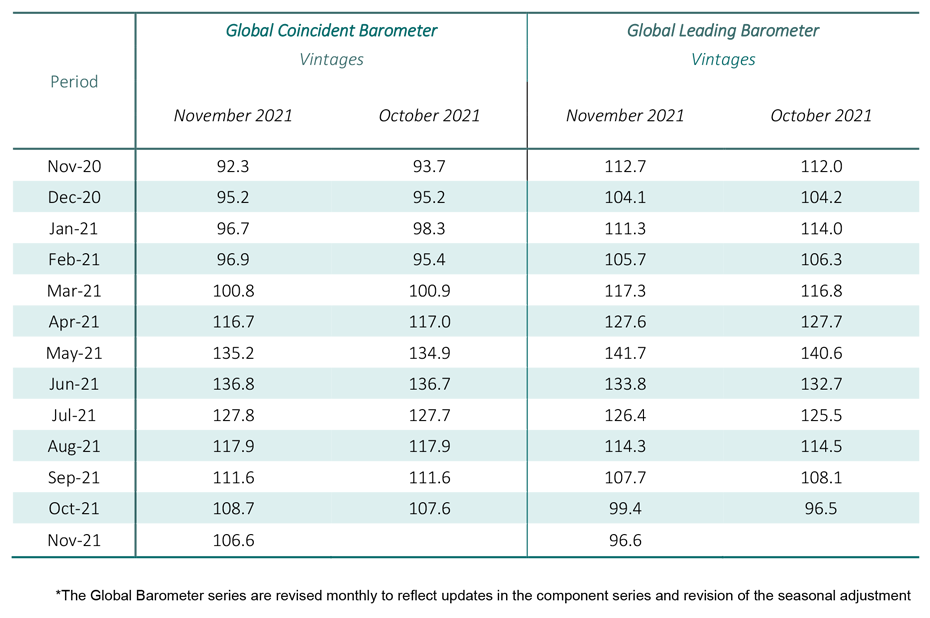
The Coincident Global Economic Barometer falls by 2.1 points in November to 106.6 points. The Leading Global Economic Barometer decreases 2.8 points, to 96.6 points, the lowest level since July 2020 (82.4 points). With one exception, all the analysed regions develop negatively in November; Europe contributed positively to the development of the Leading Barometer.
"Supply chain issues and ongoing challenges related to the pandemic are weighing on the current and future prospects of the global economy. These skid marks caused by supply chain problems are directly related to the speed with which the global economy has recovered while still being affected by the pandemic in social and health terms. In addition, the attempt by many companies to move away from just-in-time production and accordingly rebuild inventories is exacerbating supply chain problems and price pressures", evaluates Jan-Egbert Sturm, director of KOF Swiss Economic Institute.
Coincident Barometer – regions and sectors
All regions contribute negatively to the aggregate result of the Coincident Barometer in November, with the Asia, Pacific and Africa region standing out with a contribution of 1.6 point (76%) to this month’s fall of 2.1 points in the indicator. Europe and the Western Hemisphere contribute negatively by 0.4 and 0.1 points, respectively. All regions continue to record indicators above the historical average of 100 points. The graph below illustrates the contribution of each region to the deviation of the Coincident Barometer from this historical average.
Four of the five sectoral indicators decrease in November, with the most severe fall registered in Industry. The exception was the indicator for the Services sector, which contributed positively with 0.2 points for the month. With this result, the sector returns to recording the highest level among the sector indicators, although all indicators continue to fluctuate within a narrow range of 103 to 109 points.
Leading Barometer – regions and sectors
The Leading Global Barometer leads the world economic growth rate cycle by three to six months on average. The leading indicators for the regions Asia, Pacific, and Africa and the Western Hemisphere contribute negatively with 2.4 and 1.1 points, respectively, to the decline of the overall indicator by 2.8 points. Europe is the only region to contribute positively, with 0.7 points. All regions record levels below 100 points in November 2021.
Three of the five sectors distinguished in the Leading Barometer show a decline in November. Industry, Trade, and Construction record decreases while the Services sector and the indicator that measures the general state of the Economy (aggregated business and consumer evaluations) record increases this month. With these results, Services and Trade are the most optimistic about their short term outlook. Construction records a level that reflects moderation, while Industry and Economy remain below the historical mean of 100 points, signalling an upcoming weakening in these sectors.
The full press release with tables and graphs can be found Download here (PDF, 679 KB).
More information on the Global Economic Barometers can be found here.
The Global Economic Barometers
The Global Economic Barometers are a system of indicators enabling timely analysis of global economic development. They represent a collaboration between the KOF Swiss Economic Institute of the ETH Zurich in Switzerland and Fundação Getulio Vargas (FGV), based in Rio de Janeiro, Brazil. The system consists of two composite indicators, the Coincident Barometer and the Leading Barometer. The Coincident Barometer reflects the current state of economic activity, while the Leading Barometer provides a cyclical signal roughly six months ahead of current economic developments.
The two Barometers comprise the results of economic tendency surveys conducted in more than 50 countries with the aim of achieving the broadest possible global coverage. The advantages of economic tendency surveys are that their results are usually readily available and are not substantially revised after first publication.
The Coincident Barometer includes more than 1,000 different time series, while the Leading Barometer consists of over 600 time series. Cross-correlation analysis is used to decide which individual time series are included in the barometers. This involves correlating the individual time series with a reference series. The reference series used is the year-on-year growth rate of global gross domestic product (GDP), where the individual national GDPs are aggregated at purchasing power parity to form global GDP. A time series is only included in a Barometer if it shows a sufficiently high correlation and a suitable synchronization or lead with the reference series. The time period used for this correlation analysis currently runs from January 2010 to December 2019.
The series of the two Barometers are revised each month at publication and are standardized to have a mean of 100 and a standard deviation of 10 for the 10-year period previous to the most recent observations.
The methodology is described in:
Klaus Abberger, Michael Graff, Aloisio Jr. Campelo, Anna Carolina Lemos Gouveia, Oliver Müller and Jan-Egbert Sturm (2020), The Global Economic Barometers: Composite indicators for the world economy. KOF Working Papers, vol. 471, Zurich: KOF Swiss Economic Institute, ETH Zurich, 2020.
Contact
KOF Konjunkturforschungsstelle
Leonhardstrasse 21
8092
Zürich
Switzerland