Global Barometers remain almost stable in December
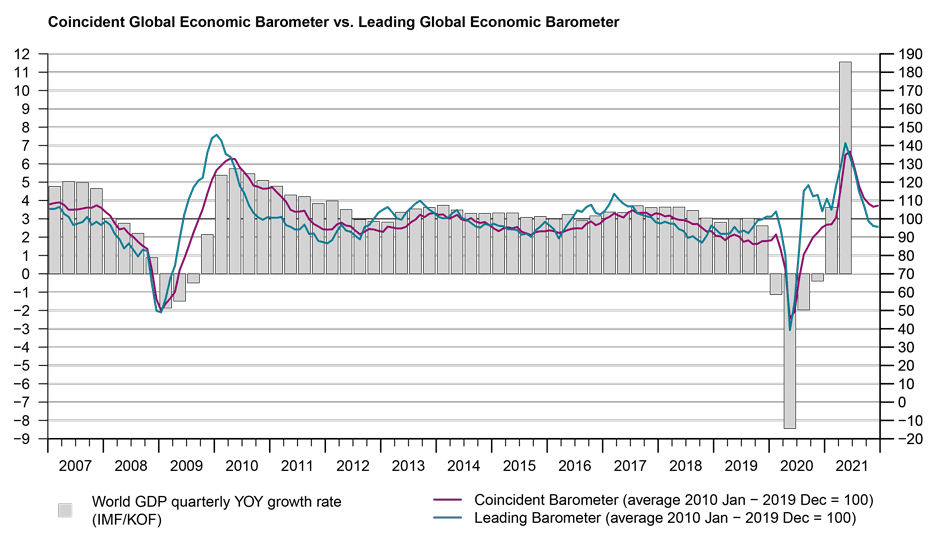
After a noticeable drop during the second semester of 2021, the Global Economic Barometers remain relatively stable in December compared to the previous month. The Coincident Barometer discontinues a sequence of decreases that began in July, while the Leading Barometer records its seventh successive, albeit modest, decrease, thereby remaining below its long-run average of 100 points and exposing the difficulties in maintaining the rate of recovery of the world economy.
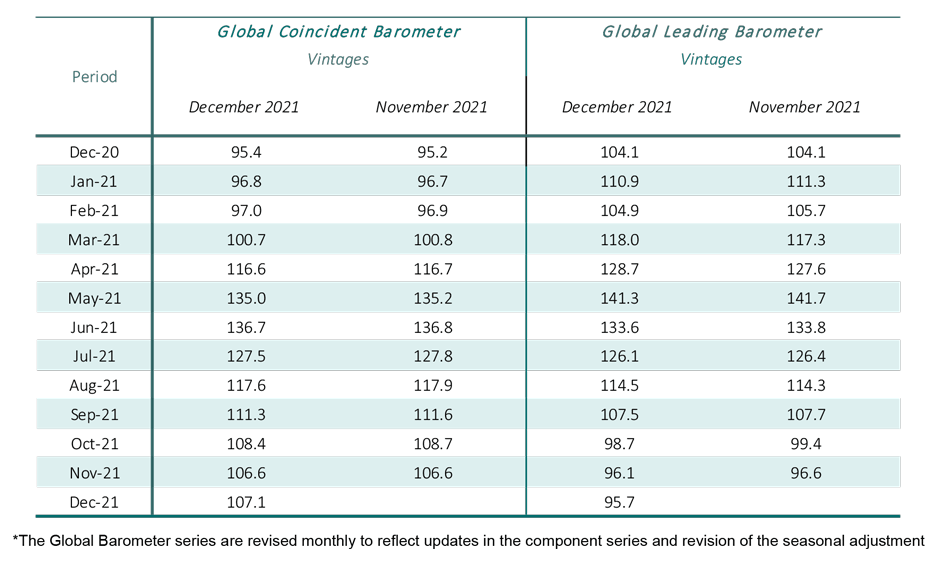
The Coincident Global Economic Barometer rises 0.5 points in December to 107.1 points. The Leading Global Economic Barometer decreases 0.4 points, to 95.7 points, the lowest level since July 2020 (83.2 points). The positive Coincident Barometer result is being determined exclusively by Europe, whereas the negative Leading Barometer result is based on developments in Asia, Pacific, and Africa and the Western Hemisphere.
“Although the pandemic remains omnipresent, the economic response to it has changed significantly over time. After a strong normalisation phase in which large parts of the goods-producing sectors boomed and the economy as a whole seems to be adapting better and better to the pandemic, we are still in a general economic normalisation process and are not falling into a clear recession. Nevertheless, the next wave of the pandemic and the uncertainty caused by the new Omicron variant are beginning to worsen the economic outlook.", evaluates Prof Jan-Egbert Sturm, director of KOF.
Coincident Barometer – regions and sectors
Europe is the only region to record an overall positive development in its Coincident Barometer in December. The indicators for the other regions remain stable. All the regions continue to record indicators above the long-run average of 100 points. The graph below illustrates the contribution of each region to the deviation of the Coincident Barometer from this historical average.
Among the sector indicators, only Industry and Trade rise in December, while the other sectors record decreases. With this result, the Trade indicator became the highest among the sector indicators for the first time since October 2019
Leading Barometer – regions and sectors
The Leading Global Barometer leads the world economic growth rate cycle by three to six months on average. The leading indicators for the Asia, Pacific, and Africa and the Western Hemisphere regions contribute negatively to the development in the global indicator (-0.4 points), with -0.5 and -0.4 points, respectively. Europe is the only region to contribute positively, with 0.5 points. All the regions record levels below 100 points in December 2021.
Three of the five sectoral indicators are declining in December: Services, Construction, and Industry. The indicators for Trade and the general state of the Economy (aggregated business and consumer evaluations) are rising. With these results, Trade remains the most optimistic sector in the short term. Construction and Services record levels that reflect moderation, while Industry and Economy remain below the historical average of 100 points, signalling a weakening tendency.
The full press release with tables and graphs can be found Download here (PDF, 684 KB).
More information on the Global Economic Barometers can be found here.
The Global Economic Barometers
The Global Economic Barometers are a system of indicators enabling timely analysis of global economic development. They represent a collaboration between the KOF Swiss Economic Institute of the ETH Zurich in Switzerland and Fundação Getulio Vargas (FGV), based in Rio de Janeiro, Brazil. The system consists of two composite indicators, the Coincident Barometer and the Leading Barometer. The Coincident Barometer reflects the current state of economic activity, while the Leading Barometer provides a cyclical signal roughly six months ahead of current economic developments.
The two Barometers comprise the results of economic tendency surveys conducted in more than 50 countries with the aim of achieving the broadest possible global coverage. The advantages of economic tendency surveys are that their results are usually readily available and are not substantially revised after first publication.
The Coincident Barometer includes more than 1,000 different time series, while the Leading Barometer consists of over 600 time series. Cross-correlation analysis is used to decide which individual time series are included in the barometers. This involves correlating the individual time series with a reference series. The reference series used is the year-on-year growth rate of global gross domestic product (GDP), where the individual national GDPs are aggregated at purchasing power parity to form global GDP. A time series is only included in a Barometer if it shows a sufficiently high correlation and a suitable synchronization or lead with the reference series. The time period used for this correlation analysis currently runs from January 2010 to December 2019.
The series of the two Barometers are revised each month at publication and are standardized to have a mean of 100 and a standard deviation of 10 for the 10-year period previous to the most recent observations.
The methodology is described in:
Klaus Abberger, Michael Graff, Aloisio Jr. Campelo, Anna Carolina Lemos Gouveia, Oliver Müller and Jan-Egbert Sturm (2020), The Global Economic Barometers: Composite indicators for the world economy. KOF Working Papers, vol. 471, Zurich: KOF Swiss Economic Institute, ETH Zurich, 2020.
Contact
KOF Konjunkturforschungsstelle
Leonhardstrasse 21
8092
Zürich
Switzerland