Global Barometers indicate slight improvement at the beginning of 2022
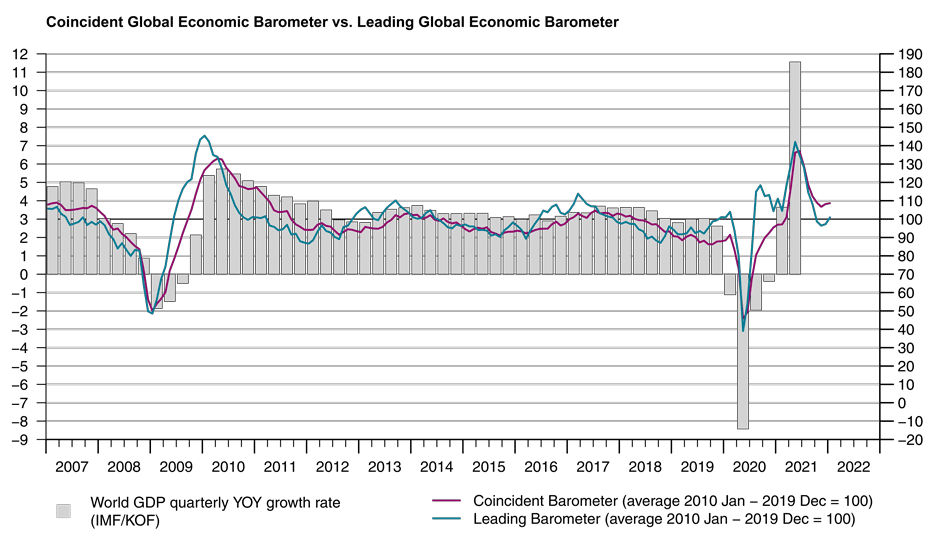
After declining throughout most of the second semester of 2021, the Global Economic Barometers rise in January for the second consecutive month. The Coincident Barometer remains above the historical mean, while the Leading Barometer returns to the neutral range of 100 points.
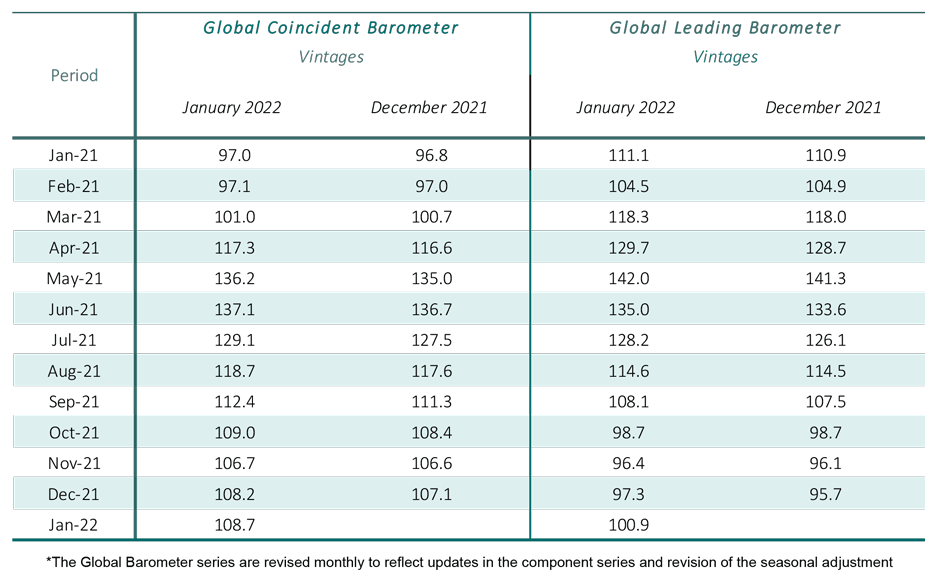
The Coincident Global Economic Barometer rises 0.4 points in January to 108.7 points, while the Leading Global Economic Barometer increases 3.6 points, to 100.9 points, the highest level since September 2021 (108.1 points). Both results are influenced by the improvement in the economic environment in the Asia, Pacific, and Africa region.
“While the omicron wave has reached large parts of the Western world, Asia has so far been largely spared. At the same time, there are initial signs that the supply chain problems that partly shaped global economic development in 2021 are slowly dissipating. All of this is reflected in the latest barometers, with Asia and the industrial sector providing the strongest positive impulses, although other areas are already clearly countering this again; there is growing uncertainty in connection with the current omicron wave”, evaluates Jan-Egbert Sturm, director of KOF Swiss Economic Institute.
Coincident Barometer – regions and sectors
The Asia, Pacific & Africa region contributes 1.3 points to the increase in the Global Coincident Barometer, while the Western Hemisphere contributes with 0.1 point. Europe, in turn, moves in the opposite direction with a negative contribution of 1.0 point to the aggregate result. Despite the decrease, the regional indicator for Europe remains at the highest level among the three regions (112.4 points).
Among the sector indicators, only Industry rises in January, while the other sectors continue to signal a deceleration in the level of activity. All sectors remain in the favourable zone, and the indicator for Industry is the highest among the sector indicators now, which has not been the case since October 2021.
Leading Barometer – regions and sectors
The Leading Global Barometer leads the world economic growth rate cycle by three to six months on average. As with the Coincident Barometer, the Asia, Pacific and Africa region accounts for the largest contribution to the development of the Leading Barometer in January 2022, with 3.2 points. Europe also contributes positively with 0.7 points. However, the indicator for the Western Hemisphere contributes negatively, with -0.3 points, and moves deeper below average, closing the month 10 points below the 100-point neutrality level. The result reflects the increased risk to growth associated with the advance of the Omicron variant of COVID-19 in the region and the cyclical deceleration foreseen in countries like Brazil.
Two of the five sectoral indicators are rising in January: Industry and Services. The other indicators are decreasing. Therefore, the indicator that measures the general state of the Economy (aggregated business and consumer evaluations) ends the month below 90 points, and 20 points below the indicator for the Services sector, which is the most optimistic. On the one hand, the result indicates a divergence between the perceptions of businesses and consumers, and, on the other hand, the continued favourable development of the services sectors dependent on current consumption, exactly those which had most suffered at times of restrictions on mobility during the COVID-19 pandemic.
The full press release with tables and graphs can be found Download here (PDF, 699 KB).
More information on the Global Economic Barometers can be found here.
The Global Economic Barometers
The Global Economic Barometers are a system of indicators enabling timely analysis of global economic development. They represent a collaboration between the KOF Swiss Economic Institute of the ETH Zurich in Switzerland and Fundação Getulio Vargas (FGV), based in Rio de Janeiro, Brazil. The system consists of two composite indicators, the Coincident Barometer and the Leading Barometer. The Coincident Barometer reflects the current state of economic activity, while the Leading Barometer provides a cyclical signal roughly six months ahead of current economic developments.
The two Barometers comprise the results of economic tendency surveys conducted in more than 50 countries with the aim of achieving the broadest possible global coverage. The advantages of economic tendency surveys are that their results are usually readily available and are not substantially revised after first publication.
The Coincident Barometer includes more than 1,000 different time series, while the Leading Barometer consists of over 600 time series. Cross-correlation analysis is used to decide which individual time series are included in the barometers. This involves correlating the individual time series with a reference series. The reference series used is the year-on-year growth rate of global gross domestic product (GDP), where the individual national GDPs are aggregated at purchasing power parity to form global GDP. A time series is only included in a Barometer if it shows a sufficiently high correlation and a suitable synchronization or lead with the reference series. The time period used for this correlation analysis currently runs from January 2010 to December 2019.
The series of the two Barometers are revised each month at publication and are standardized to have a mean of 100 and a standard deviation of 10 for the 10-year period previous to the most recent observations.
The methodology is described in:
Klaus Abberger, Michael Graff, Aloisio Jr. Campelo, Anna Carolina Lemos Gouveia, Oliver Müller and Jan-Egbert Sturm (2020), The Global Economic Barometers: Composite indicators for the world economy. KOF Working Papers, vol. 471, Zurich: KOF Swiss Economic Institute, ETH Zurich, 2020.
Contact
KOF Konjunkturforschungsstelle
Leonhardstrasse 21
8092
Zürich
Switzerland