Global Barometers decrease slightly
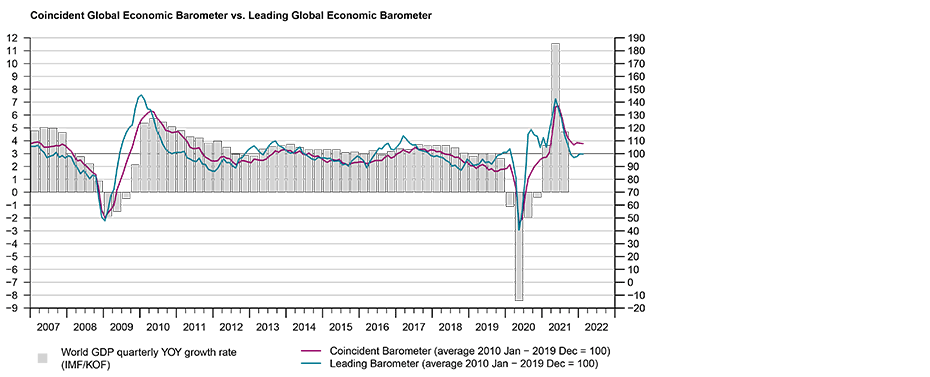
The Global Barometers fall slightly in February consolidating the baseline reached since December 2021. Back then, the indices rose following five months of significant losses. The coincident indicator signals a still above average pace for the global economy in the first months of 2022. The leading indicator indicates a continuing normalisation.
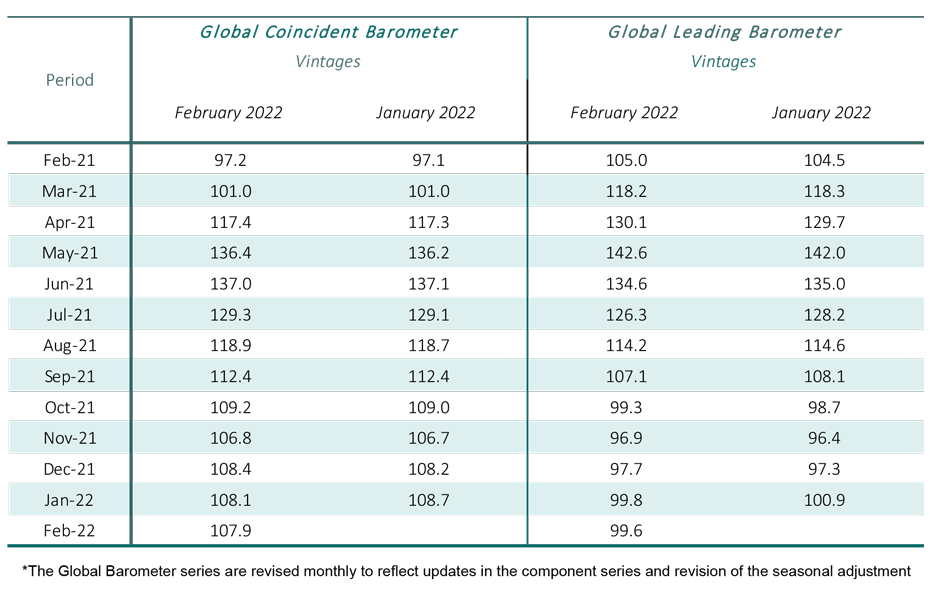
The Coincident Global Economic Barometer falls 0.3 points in February, to 107.9 points, while the Leading Global Economic Barometer decreases 0.2 points, to 99.6 points. The Coincident Barometer development was mainly influenced by the Western Hemisphere, while the Leading Barometer result was determined by the Asia, Pacific, and Africa region.
“Both the coincident and leading global barometers indicate relative stability on the economic front. While the coincident indicator still clearly signals above-average growth performance, the leading indicator points to a continuing normalisation. Neither ongoing supply-side constraints, inflationary pressures, changes in the monetary policy stance nor geopolitical tensions seem to be distorting the current outlook strongly”, evaluates Jan-Egbert Sturm, director of KOF Swiss Economic Institute.
Coincident Barometer – regions and sectors
In February 2022, the regional indicators develop heterogeneously. Only the indicator for the Western Hemisphere contributes negatively to the decrease in the Coincident Global Barometer, with -0.8 points, while Europe remains stable, and the Asia, Pacific, and Africa region contributes positively with 0.5 points for the month. Despite the null contribution from Europe to the monthly result, its regional indicator remains the highest among the three regions, at 112 points. The graph below illustrates the contribution of each region to the deviation of the Coincident Barometer from the historical average of 100 points.
Only the indicator Economy, which is based on variables representing overall business and consumer evaluations, decreases in February. The indicators representing more specific business sectors present positive developments for the month. This holds especially for Trade, which increases 6.0 points thereby reaching a level just below that of Industry. This is the first time since May 2017 that the indicator for the general state of the Economy records the lowest level among all sectors.
Leading Barometer – regions and sectors
The Leading Global Barometer leads the world economic growth rate cycle by three to six months on average. Only the Asia, Pacific and Africa region contributes negatively to the development of the Leading Barometer in February 2022, with -2.1 points. The Western Hemisphere contributes positively, with 1.6 points, followed by Europe with 0.3 points. This is the first positive contribution of the Western Hemisphere since May 2021.
Three of the five Leading sector indicators are decreasing this month: Industry, Trade, and Services. The other two indicators record increases, with the indicator for the general state of the Economy standing out, with a rise of 8.0 points. Nevertheless, the result continues to reflect a great divergence between the perceptions of businesses and consumers.
The full press release with tables and graphs can be found Download here (PDF, 670 KB).
More information on the Global Economic Barometers can be found here.
The Global Economic Barometers
The Global Economic Barometers are a system of indicators enabling timely analysis of global economic development. They represent a collaboration between the KOF Swiss Economic Institute of the ETH Zurich in Switzerland and Fundação Getulio Vargas (FGV), based in Rio de Janeiro, Brazil. The system consists of two composite indicators, the Coincident Barometer and the Leading Barometer. The Coincident Barometer reflects the current state of economic activity, while the Leading Barometer provides a cyclical signal roughly six months ahead of current economic developments.
The two Barometers comprise the results of economic tendency surveys conducted in more than 50 countries with the aim of achieving the broadest possible global coverage. The advantages of economic tendency surveys are that their results are usually readily available and are not substantially revised after first publication.
The Coincident Barometer includes more than 1,000 different time series, while the Leading Barometer consists of over 600 time series. Cross-correlation analysis is used to decide which individual time series are included in the barometers. This involves correlating the individual time series with a reference series. The reference series used is the year-on-year growth rate of global gross domestic product (GDP), where the individual national GDPs are aggregated at purchasing power parity to form global GDP. A time series is only included in a Barometer if it shows a sufficiently high correlation and a suitable synchronization or lead with the reference series. The time period used for this correlation analysis currently runs from January 2010 to December 2019.
The series of the two Barometers are revised each month at publication and are standardized to have a mean of 100 and a standard deviation of 10 for the 10-year period previous to the most recent observations.
The methodology is described in:
Klaus Abberger, Michael Graff, Aloisio Jr. Campelo, Anna Carolina Lemos Gouveia, Oliver Müller and Jan-Egbert Sturm (2020), The Global Economic Barometers: Composite indicators for the world economy. KOF Working Papers, vol. 471, Zurich: KOF Swiss Economic Institute, ETH Zurich, 2020.
Contact
KOF Konjunkturforschungsstelle
Leonhardstrasse 21
8092
Zürich
Switzerland