Global Barometers continue to signal a slowdown of the world economy for the coming months
The Global Barometers fall once again in November after a slight improvement in the previous month. With the results, the Coincident Barometer reaches its lowest level since August 2020 and the Leading Barometer is the second lowest since June 2020, beating only the level of last August.
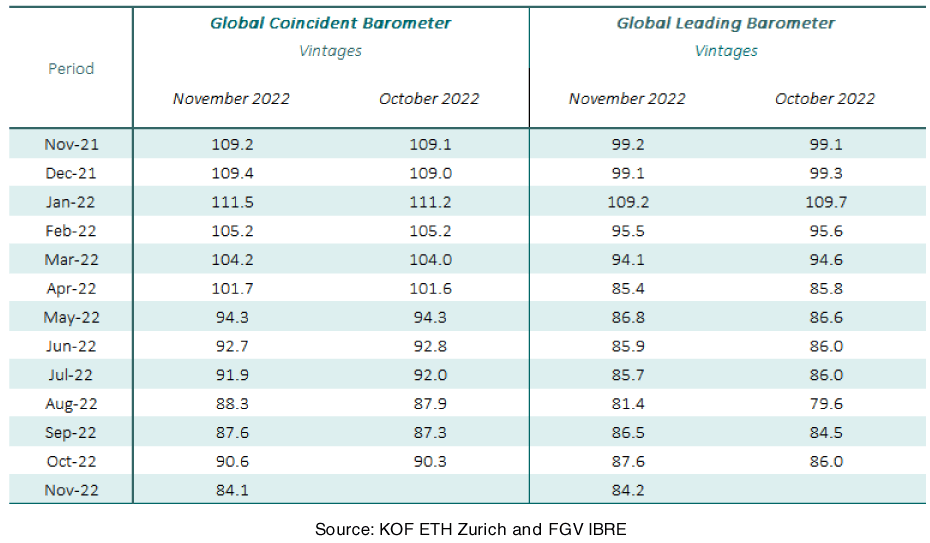
The Coincident Global Economic Barometer falls 6.5 points and the Leading Global Economic Barometer 3.4 points in November. With this result, the two indicators are getting closer to each other, recording 84.1 points and 84.2 points, respectively. The drop in the indicators is fuelled mainly by the Asia, Pacific & Africa region. Only the Leading indicator for Europe records a slight improvement this month.
“The decline in both the coincident and leading indicators for the global economy this month shows that the trough of this cycle is still ahead of us. However, the fact that the two indicators have reached almost the same (low) level could also be taken as a sign that this trough is not far off and, fortunately, will probably not be as low as during the financial crisis or the first wave of the pandemic. Nevertheless, the world economy is in a recessionary phase, which, at least in Europe, is mainly caused by an energy crisis triggered by the war in Ukraine”, evaluates KOF Director Jan-Egbert Sturm.
“The decline in both the coincident and leading indicators for the global economy this month shows that the trough of this cycle is still ahead of us.”Jan-Egbert Sturm, KOF Director

Coincident Barometer – regions and sectors
In November, the Asia, Pacific & Africa region contributes 5.2 points to the decrease in the Coincident indicator, while the Western Hemisphere and Europe regions contribute -0.9 points and -0.4 points, respectively. The regional indicator for Europe has now recorded a sequence of eleven consecutive decreases and is at the lowest level among the regions. The macroeconomic situation for 2022, with the war in Ukraine and its consequences, such as the energy supply crisis in European countries, continue to define the adverse framework of the region. The graph below illustrates the contribution of each region to the deviation of the Coincident Barometer from the historical mean of 100 points.
Among the coincident sector indicators, only Trade increases this month. The Services indicator drops almost 15 points and Industry almost 8.0 points. With this result, the indicator for the general state of the Economy (aggregated business and consumer evaluations), Industry, Services, and Trade are in the 80-90-point band, while Construction drops further away from the historic mean of 100 points.
Leading Barometer – regions and sectors
The Leading Global Barometer leads the world economic growth rate cycle by three to six months on average. In November, the Asia, Pacific & Africa region and the Western Hemisphere contribute negatively to the fall in the indicator, with -3.1 points and -0.8 points, respectively, while Europe contributes to a movement in the opposite direction with 0.5 points. The indicators portray a scenario that remains pessimistic for these economies for the coming months, fluctuating in the 80-90-point band since April of this year.
Among the Leading indicator sectors, only the general state of the Economy (aggregated business and consumer evaluations) does not fall in November. The Trade indicator remains at the lowest level among the sectors and Construction at the highest.
The Global Economic Barometers
The Global Economic Barometers are a system of indicators enabling timely analysis of global economic development. They represent a collaboration between the KOF Swiss Economic Institute of the ETH Zurich in Switzerland and Fundação Getulio Vargas (FGV), based in Rio de Janeiro, Brazil. The system consists of two composite indicators, the Coincident Barometer and the Leading Barometer. The Coincident Barometer reflects the current state of economic activity, while the Leading Barometer provides a cyclical signal roughly six months ahead of current economic developments.
The two Barometers comprise the results of economic tendency surveys conducted in more than 50 countries with the aim of achieving the broadest possible global coverage. The advantages of economic tendency surveys are that their results are usually readily available and are not substantially revised after first publication.
The Coincident Barometer includes more than 1,000 different time series, while the Leading Barometer consists of over 600 time series. Cross-correlation analysis is used to decide which individual time series are included in the barometers. This involves correlating the individual time series with a reference series. The reference series used is the year-on-year growth rate of global gross domestic product (GDP), where the individual national GDPs are aggregated at purchasing power parity to form global GDP. A time series is only included in a Barometer if it shows a sufficiently high correlation and a suitable synchronization or lead with the reference series. The time period used for this correlation analysis currently runs from January 2010 to December 2019.
The series of the two Barometers are revised each month at publication and are standardized to have a mean of 100 and a standard deviation of 10 for the 10-year period previous to the most recent observations.
The methodology is described in:
Klaus Abberger, Michael Graff, Aloisio Jr. Campelo, Anna Carolina Lemos Gouveia, Oliver Müller and Jan-Egbert Sturm (2020), The Global Economic Barometers: Composite indicators for the world economy. KOF Working Papers, vol. 471, Zurich: KOF Swiss Economic Institute, ETH Zurich, 2020.
Contact
KOF Konjunkturforschungsstelle
Leonhardstrasse 21
8092
Zürich
Switzerland