KOF Youth Labour Market Index: When a Skills Mismatch isn’t the Same as a Skills Mismatch
- KOF Bulletin
- KOF Youth Labour Market Indicator
Is the high level of the skills mismatch in the United Kingdom comparable with the high level in Germany? The special analysis in the new release of the KOF Labour Market Index provides an answer to this. The investigation shows that there can be various causes for an identical Skills Mismatch Rate. In order to identify an appropriate way of dealing with a skills mismatch within given country, it is necessary to consider the individual components of the indicator.

The KOF Youth Labour Market Index (KOF YLMI) presents the labour market situation for young people according to a multi-dimensional approach. It takes account of twelve indicators, spread over the four dimensions Activity State, Working Conditions, Education and Transition Smoothness, which are aggregated into an index. The fifth release of the KOF YLMI incorporates data for the year 2016. The new data confirm the leading position of Switzerland, which occupies second place in the international ranking.
The components of skills mismatch
The special analysis in the new release of the KOF YLMI focuses on the Skills Mismatch Rate, which falls under the Education dimension. A skills mismatch exists if the demand for staff does not match up with the supply of workers. In order to gain a feeling for the various manifestations of this indicator, the Skills Mismatch Rate has been broken down into its components. The definition of the Skills Mismatch Rate used in the KOF YLMI is based on a so-called index of inequality. This is calculated as the difference between the proportions of workers with a qualification at primary, secondary and tertiary level, and the proportions of unemployed persons at the same three levels. For example, if the proportion of unemployed persons with a primary level qualification is significantly higher than the proportion of workers with the same qualification, there will be deemed to be an oversupply of young persons holding a primary qualification. On the other hand, there is considered to be overdemand if the proportion of unemployed persons holding a primary qualification is significantly lower than the proportion of workers with the same qualification. The same terminology is also used for young persons holding a secondary or tertiary qualification.
A taxonomy of skills mismatch
The analyses indicate that the driving forces behind the Skills Mismatch Rate differ significantly from country to country. The greatest differences between patterns can be found in particular at secondary and tertiary level. On the other hand, all countries – other than Turkey as the sole exception – have an oversupply at primary level. Graph G 4 presents a possible taxonomy (classification) in order to better classify the various patterns. The x-axis indicates the level of the Skills Mismatch Rate, which may fall between 1 and 100. The y-axis shows in the upper area that the overdemand for young persons with tertiary education is greater than the overdemand for young persons with secondary education (y>0). In the lower area, the overdemand for young persons with a secondary level qualification is greater than the overdemand for young persons with a tertiary level qualification (y<0).
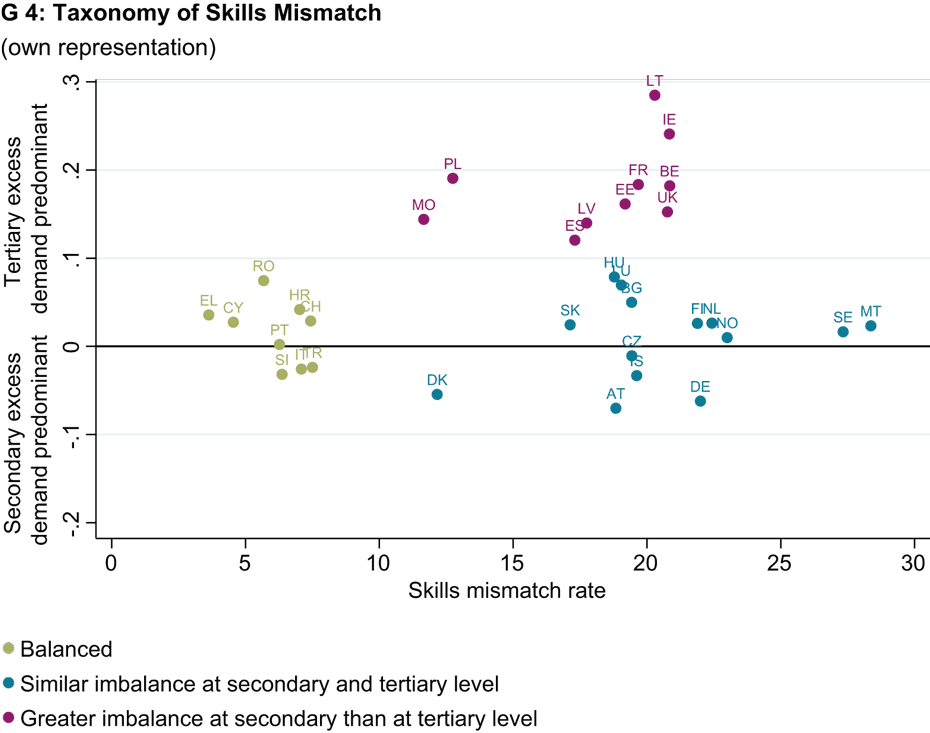
Overall, it is possible to form three groups. The first group (green) is characterised by a relatively low level of the Skills Mismatch Rate. In countries such as Greece, Cyprus, Romania, Croatia and Switzerland the overdemand at tertiary level is slightly higher than the overdemand at secondary level. On the other hand, the opposite is the case for Slovenia, Italy and Turkey. In Portugal the overdemand at secondary level is practically the same as it is at tertiary level.
If one focuses on the countries with a higher Skills Mismatch Rate, a further group of countries can be observed (blue), which are distributed around the horizontal line. This means that the overdemand for young persons with secondary and tertiary education is practically the same. Five of these countries – Denmark, Austria, Czech Republic, Iceland and Germany – have overdemand at secondary level that is slightly higher than the overdemand at tertiary level (situated below the line). For the other nine countries – Slovakia, Hungary, Luxembourg, Bulgaria, Finland, the Netherlands, Norway, Sweden and Malta – the overdemand at tertiary level is somewhat greater than the overdemand at secondary level.
The third group (pink) is comprised of all countries in which the overdemand at tertiary level is clearly predominant. This means that the Skills Mismatch Rate in these countries results mainly from the extremely high overdemand for workers with a tertiary education qualification. This group includes Montenegro, Poland, Spain, Latvia, Estonia, France, Belgium, the United Kingdom, Ireland and Lithuania.
To summarise, it may be stated that there is considerable heterogeneity within the pattern of the Skills Mismatch Rate. It is therefore important not only to consider the skills mismatch on an aggregate level but also to consider the causes of the different weightings.
Contact
No database information available
No database information available