A Behind-the-Scenes Look at the Balance of Swiss Foreign Trade
- Business Cycle
- KOF Bulletin
Swiss exports reached a high water mark in 2018. Exports rose significantly for the most important categories of goods. However, the position becomes slightly more nuanced when considered more closely: during the second half of the year the dynamism fell back, above all in the machinery, electronics and metal industry.

Exporte and import scale new heights
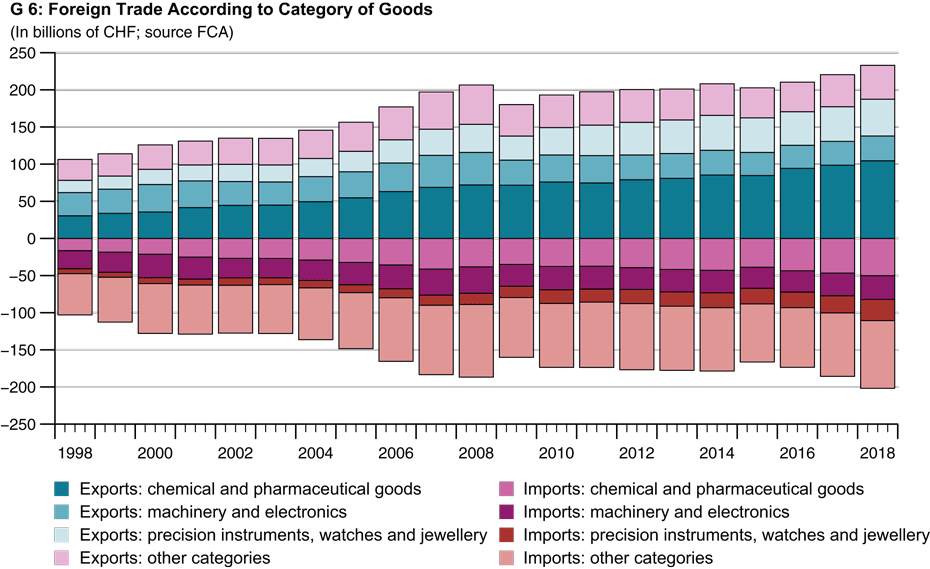
Last year, Switzerland exported goods worth CHF 233.1 billion, representing a rise of 5.7% or CHF 12.5 billion on the previous year, thus reaching an all-time high. All three of the most important categories of goods posted strong gains. Exports in the chemical and pharmaceutical industry grew by 5.9%, those of precision instruments, watches and jewellery were up by as much as 6.1%, whilst exports by the machinery and electronics industry posted a gain of 4.6%, the strongest growth since 2011 (see G 6). The dynamic for imports was even more marked last year than it was for exports. 2018 saw imports of goods worth CHF 201.8 billion, representing growth of 8.6% compared to the previous year. Alongside the three major export categories, imports of clothing, metal goods and vehicles increased last year.
Without pharmaceutical goods there would be a deficit
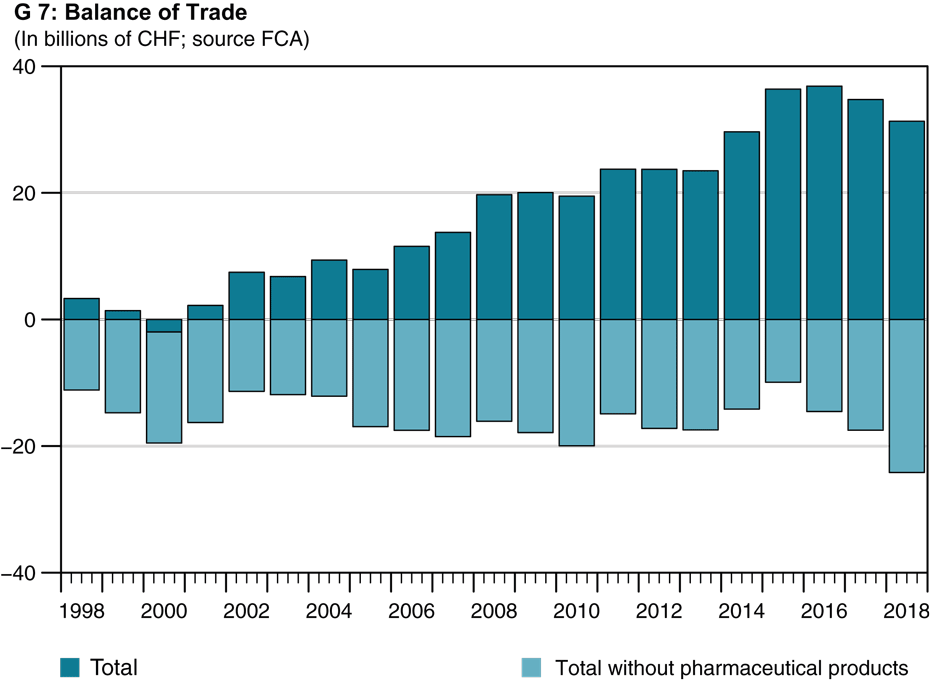
The strong rise in imports reduced the positive balance of trade last year (see G 7). However, the surplus, at CHF 31.3 billion or 4.5% of the nominal gross domestic product (GDP), remains high compared to other countries. The most important category of goods, pharmaceutical products, is mainly responsible for the surplus. Without this category of goods, which accounts for 42% of total exports and 21% of total imports, the trade balance would be in deficit by CHF 24.2 billion. This deficit has increased steadily - in particular since the increase in the value of the Swiss franc in 2015 due to a strong rise in imports - whilst exports have remained stable.
Strong demand for Swiss goods in the USA and Europe
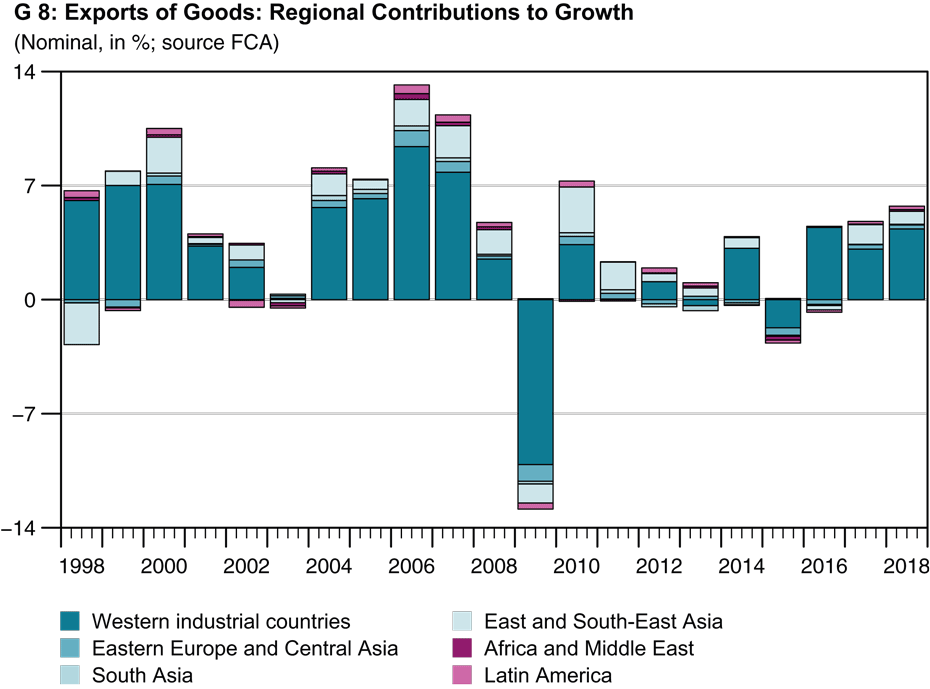
Although the developing economies represent strong growth markets for Swiss exporters of goods, the western industrial countries continue to provide the greatest contributions to growth due to their high share of exports. Out of the export growth of 5.7% last year, 4.3 percentage points related to trade with western industrial countries (see G 8). Demand for Swiss goods last year was high in particular in the USA and Eurozone countries. Exports to east and south-east Asia, the second most important group of countries, contributed 0.8 percentage points to the result. Export volumes were higher also for other regions, with the exception of the Gulf states. Trade in pharmaceutical products saw a rerouting of a large share of exports of goods from the United Kingdom to the Netherlands, which could be related to an adjustment within the distribution networks of major pharmaceutical companies in the run-up to Brexit.
Exports became significantly less dynamic during the second half of 2018
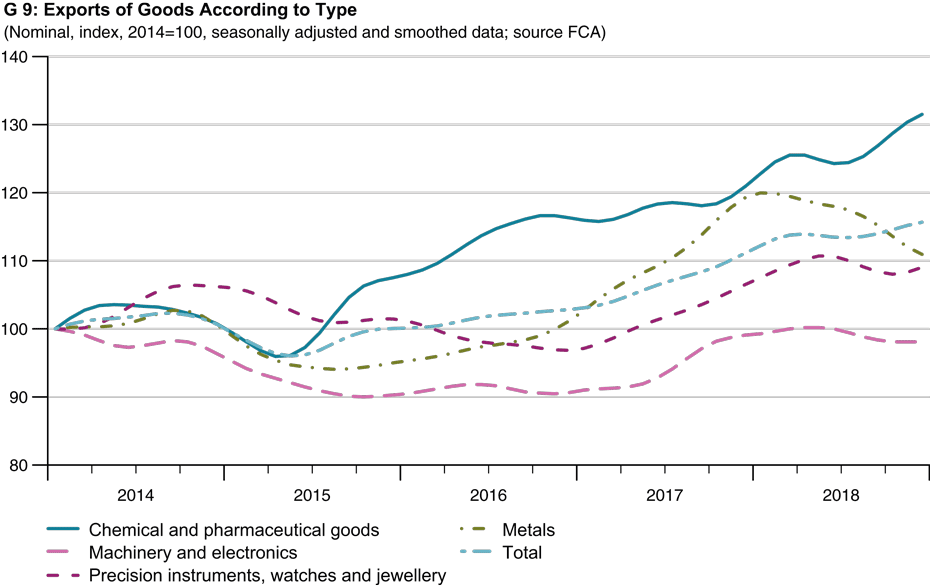
The sound performance by exports last year reached its high point around the middle of the year. Taking into account the individual categories of goods, it is clear that exports became much less dynamic in the second half of 2018, in particular in the machinery, electronics and metal industry (see G 9). This was predominantly due to the darkening of the mood for the most important trade partners, coupled with uncertainty concerning the future development of the world economy. This came in parallel with the cutting back of production in the German automobile industry in the third quarter, with the corresponding knock-on effects for Swiss supply chains. Exports of watches also flatlined during the second half of the year, in the wake of the strong growth trend ongoing since 2017. The trade war appears to have dampened consumer sentiment in China, which depressed exports of watches and other jewellery. The only engine of growth during the second half of the year was the pharmaceutical sector, which is less sensitive to cyclical developments.
1) The following text concerns the share of trade in goods that is relevant for the economy (total 1) and disregards transit trade and valuable items, including non-monetary gold.
2) These calculations count goods from category 06.2 in foreign trade statistics as pharmaceutical products.
Contact
No database information available