KOF Business Situation Indicator: economy no longer in freefall
- KOF Business Situation Indicator
- KOF Bulletin
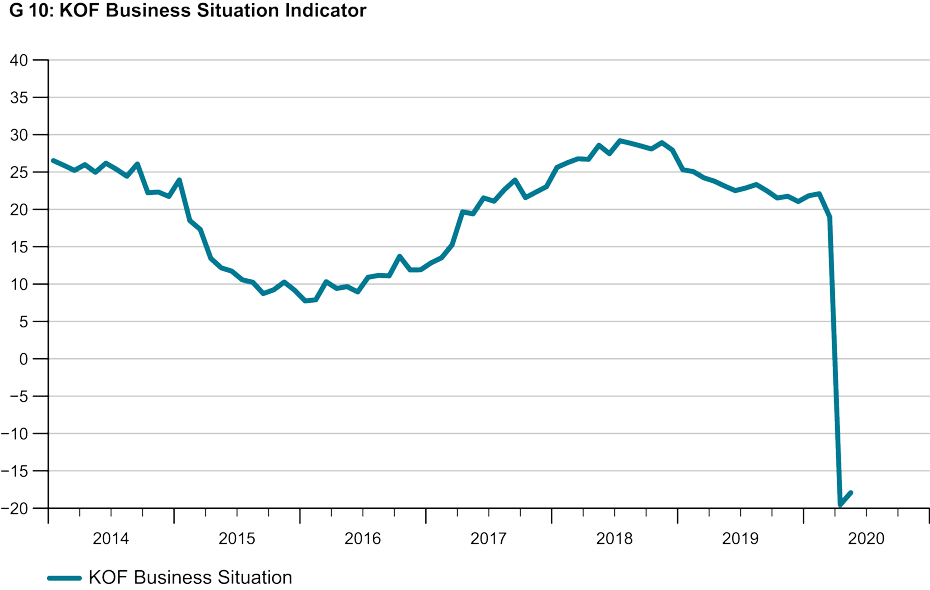
The KOF Business Situation Indicator regained some ground in May after having crashed in the previous month: the indicator is rising very modestly (Graph G 10). Nevertheless, Swiss companies reckon that their current situation is significantly worse than it was during the 2009 financial crisis. Although the Swiss economy is still in recession, it is no longer in freefall.
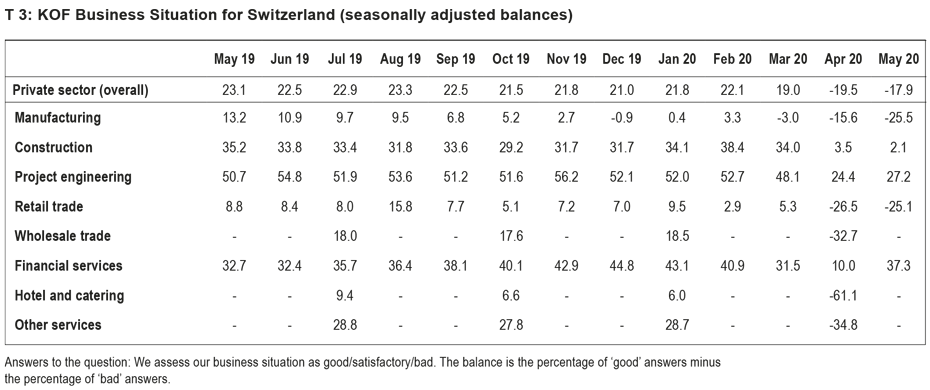
Economic performance in May varied from one sector to another. The situation in financial and insurance services improved considerably. There was little change in the business situation of the project engineering, construction and retail sectors following massive setbacks in the previous month. In manufacturing, however, the Business Situation Indicator continued to decline. Incoming orders here slowed down and order books contracted. At the same time, more was produced for inventory. However, there was also a glimmer of hope in the manufacturing sector: forecasts of incoming orders in the near future were no longer as negative as in April.
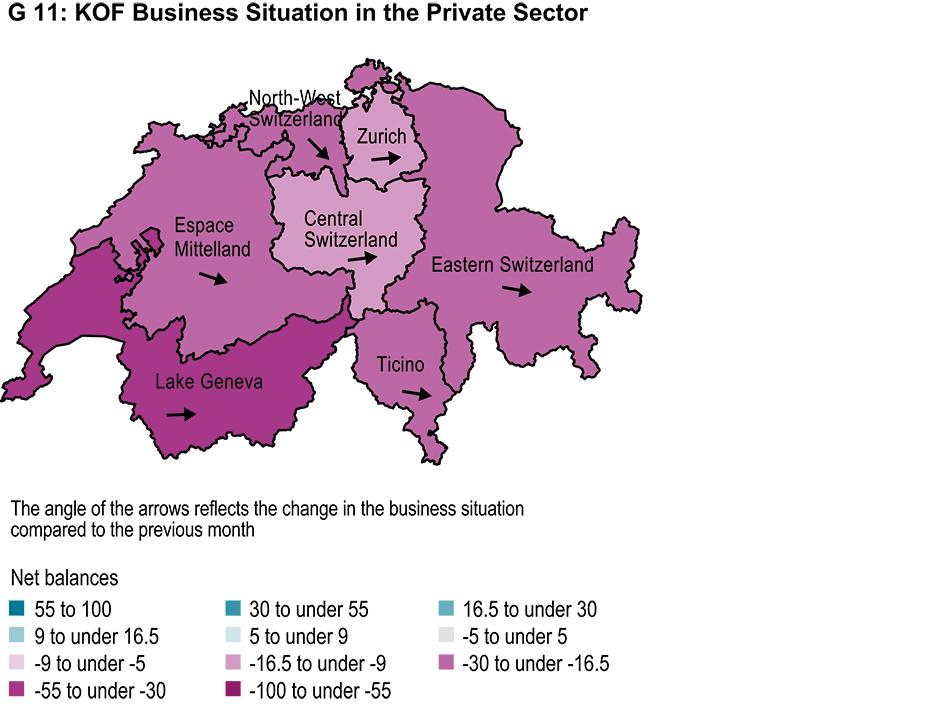
From a regional perspective, stabilisation has come from the Swiss Federal Statistical Office’s (FSO's) key regions of Central Switzerland, Zurich and (at a very low level) the Lake Geneva area (Graph G 11). In addition, the Business Situation Indicator for Eastern Switzerland, Ticino and Espace Mittelland fell only slightly in May. Its decline was somewhat more pronounced in Northwestern Switzerland.
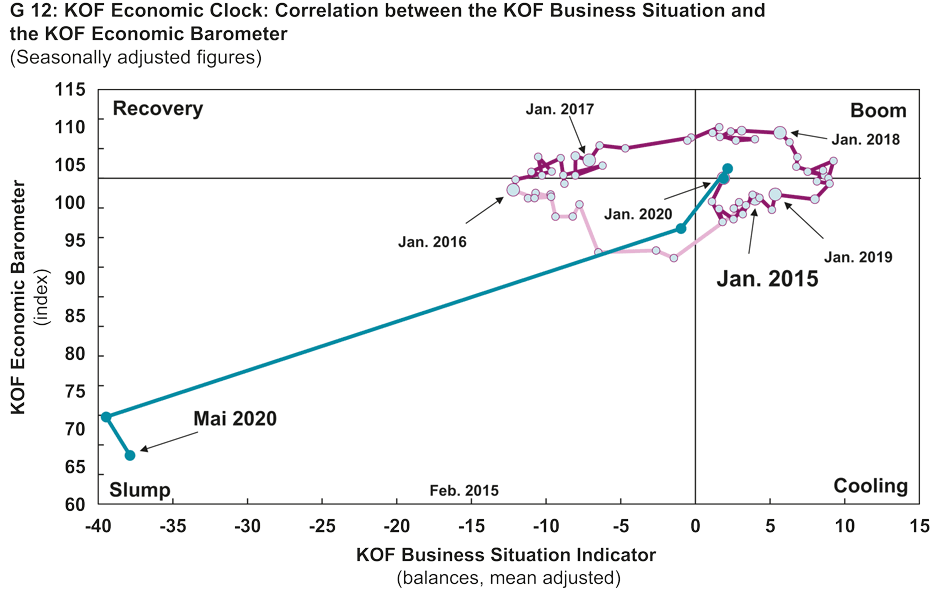
The KOF Business Situation Indicator illustrates companies’ current business situation. The KOF Economic Barometer, on the other hand, is an indicator of economic prospects. The Economic Clock shows that the economy was under pressure in 2019 (Graph G 12). The Economic Barometer remained below its long-term average throughout the year and business activity weakened gradually. At the beginning of 2020 the outlook for the Swiss economy was more upbeat. The COVID-19 pandemic, however, has led to a sharp slowdown in economic activity. Despite the gradual easing of lockdown restrictions, the economic outlook remains very bleak.
Explanation:
Chart G 10 shows the KOF Business Situation Indicator across all sectors included in the survey. The business situation of sectors that are only surveyed quarterly is kept constant in the interim months.
Chart G 11 shows the business situation in the key regions as defined by the FSO. The regions are coloured differently depending on their business situation. The arrows within the regions indicate the change in the situation compared with the previous month. An upward-pointing arrow means, for example, that the situation has improved compared with the previous month.
The Business Situation Indicator in the KOF Economic Clock (Chart G 12) is plotted against the KOF Economic Barometer. The Business Situation Indicator reflects the current business situation, while the barometer is a leading indicator of changes in activity. The clock can be divided into quadrants. During the recovery phase the business situation is below average but growth prospects are above average. At the peak of the economic cycle the situation and prospects are both above average. During the slowdown phase the situation is above average and the prospects are below average. At the bottom of the economic cycle the situation and prospects are both below average. Ideally the chart runs through the quadrants in a clockwise direction.
The KOF Business Situation Indicator is based on more than 4,500 reports from firms in Switzerland. Companies in industry, the retail sector, construction, project engineering, and financial and insurance services are surveyed monthly. Businesses in the hospitality, wholesale and other services sectors are surveyed during the first month of each quarter. These firms are asked, among other things, to assess their current business situation. They can rate their situation as either ‘good’, ‘satisfactory’ or ‘poor’. The net balance of their current business situation is the difference between the percentages of ‘good’ and ‘poor’ responses.
Contact
KOF Konjunkturforschungsstelle
Leonhardstrasse 21
8092
Zürich
Switzerland