Global Economic Barometers: Increased Impact of COVID-19 on the International Economy
In the April 2020 edition, the Global Leading Barometer and the Global Coincident Barometer have fallen sharply, reflecting the impact of the COVID-19 pandemic on the world economy. The second consecutive decrease in the two barometers shows that the economies of all regions were seriously shaken by the pandemic.
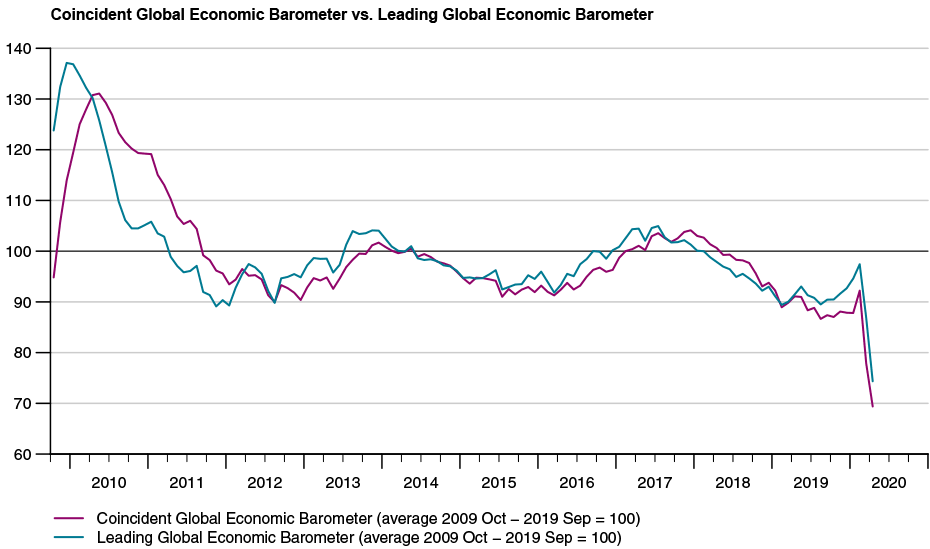
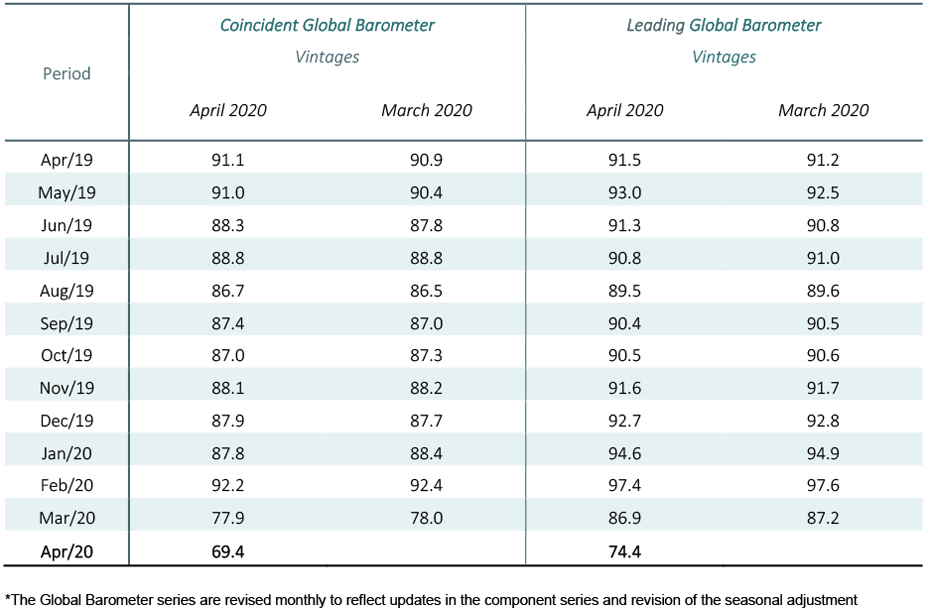
The Global Coincident Barometer dropped 8.5 points in April 2020, to 69.4 index points (from 77.9 in March). This is the lowest level since May 2009 and signals a deepening of the deceleration in World GDP. While in March the decrease in the indicator was concentrated in the Asia, Pacific, and Africa regional bundle, it has spread this month to all regions. The Asia, Pacific, and Africa region once again exercised the largest negative contribution to the result, followed by the Western Hemisphere (North America, Latin America and the Caribbean) and Europe. Compared to the previous month, especially the contribution of the Western hemisphere has become more negative. The negative contribution of Europe has only increased slightly in April.
In terms of economic sectors, the largest contribution to the fall came from the set of variables reflecting the aggregated evolution of economies (Overall Economic Development), followed by the trade sector (wholesale and retail), industry and services. The construction sector has been suffering less than the others, but the fall in April surpassed that of the previous month.
The Leading Global Barometer declined 12.5 points in April, to 74.4 points (from 86.9 in the previous month). The Leading Barometer leads the world economic growth rate cycle by three to six months. All the regions contributed to the fall in the indicator, with the greatest negative change in contribution coming from variables in the Western Hemisphere, followed by Asia, Pacific, and Africa, and Europe.
The decrease in the Leading Barometer was well distributed in terms of sectors, with the variables connected to Overall Economic Development, Industry and Trade standing out. The lowest contribution, albeit not far off that of construction, came from the services sector, which ceased to be positive and had a negative influence on the Leading Barometer in April.
The full press release with table and graphs can be found Download here (PDF, 282 KB).
More information on the Global Economic Barometers can be found here.
The Global Economic Barometers
The Global Economic Barometers are a system of indicators that enables a timely analysis of global economic development. They represent a collaboration between the KOF Swiss Economic Institute of the ETH Zurich in Switzerland and Fundação Getulio Vargas (FGV) based in Rio de Janeiro, Brazil. The system consists of two composite indicators: a Coincident Barometer and a Leading Barometer. The Coincident Barometer reflects the current state of economic activity. The Leading Barometer, on the other hand, gives a cyclical signal that is roughly six months ahead of actual economic developments.
The two Barometers comprise the results of economic tendency surveys conducted in more than 50 countries. The aim is to achieve the broadest possible global coverage. Advantages of economic tendency surveys are that their results are usually available quickly and they are not substantially revised after the first publication.
The Coincident Barometer includes more than 1,000 different time series, while the Leading Barometer comprises over 600 time series. Cross-correlation analysis is used to decide which individual time series are included in the barometers. This involves correlating the individual time series with a reference series. The reference series used is the year-on-year growth rate of global gross domestic product (GDP), where the individual national GDPs are aggregated at purchasing power parity to form global GDP. A time series is only included in a Barometer if it shows a sufficiently high correlation and a suitable synchronisation or lead with the reference series.
The two Barometers are calculated once every month. They are usually published at the 10th of each calendar month. They are therefore available at a monthly frequency and in a timely manner.
The methodology is described in:
Download Klaus Abberger, Michael Graff, Aloisio Jr. Campelo, Anna Carolina Lemos Gouveia, Oliver Müller and Jan-Egbert Sturm (2020), The Global Economic Barometers: Composite indicators for the world economy. KOF Working Papers, vol. 471, Zurich: KOF Swiss Economic Institute, ETH Zurich, 2020.