Global Economic Barometers signal continuing recovery
The Coincident and Leading Global Economic Barometers rise in November, signaling continuity in the tendency of recovery in world economic activity, after having given slightly less positive signals in the previous month. The favorable overall development was mainly driven by the Asia, Pacific and Africa regions.
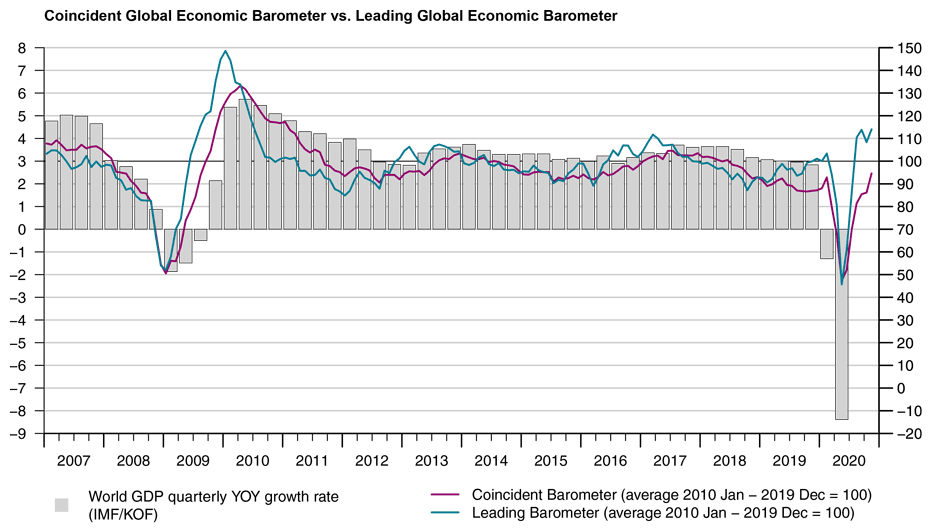
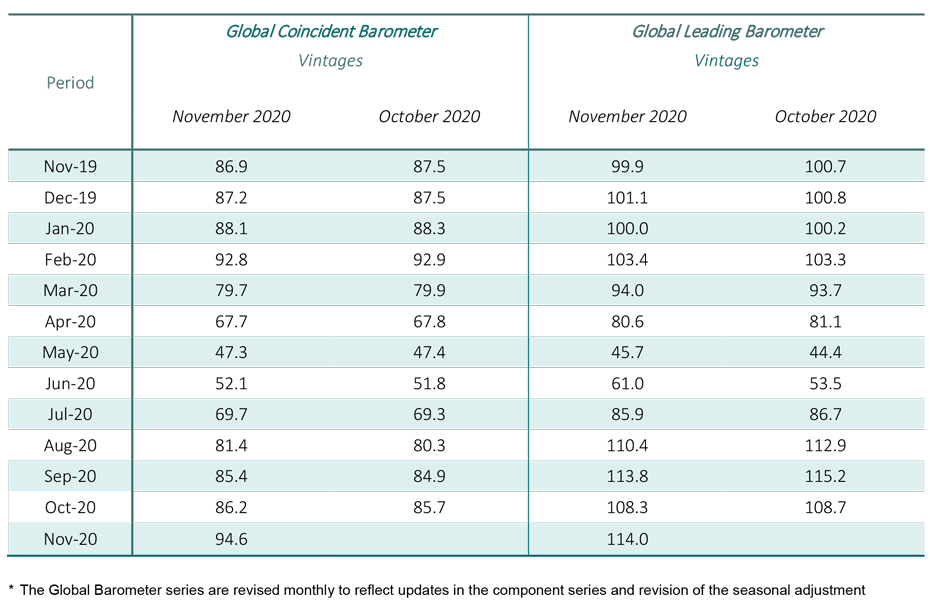
The Coincident Global Barometer rises by 8.4 points in November, jumping from 86.2 points to 94.6 points. The Leading Global Barometer climbs by 5.7 points, reaching 114.0 points, the highest level since June 2010. All regions contribute positively to the result of the Coincident Barometer, with the strongest contribution coming from Asia, Pacific and Africa. The Leading Barometer rises in Asia, Pacific and Africa and the Western Hemisphere, while Europe contributes negatively to the aggregate indicator. The pandemic worsened again in October, particularly in Europe, and in some countries protection measures were tightened during the month. This development is likely to be only partially reflected in some of the survey results collected so far.
“Most of the underlying surveys reflect the situation at the beginning of October and do not yet take into account the new wave of infections, particularly in Europe – which came as a surprise to many. Until recently, we were on a continuing recovery path. Let us hope that the pandemic does not give this a similar blow as it did early in the year,” concludes Jan-Egbert Sturm, director of KOF Swiss Economic Institute.
Coincident Barometer – regions and sectors
The Coincident Barometer for the Asia, Pacific and Africa region rises in November, contributing positively with 7.6 points, or 90%, to the result of the general indicator. The indicators for the regions of Europe and the Western Hemisphere (North America, Latin America and the Caribbean) also increase, both contribute more moderately with 0.5 and 0.4 points, respectively. The European Barometer has reached the level of the pre-pandemic period, as did the Western Hemisphere Barometer in the previous month. The Asia, Pacific and Africa region remains 0.9 points below this reference. The graph below illustrates the contribution of each region to the deviation of the Coincident Barometer from the historical average of 100 points.
The strongest sectorial contribution to the increase in the Coincident Global Barometer in November comes from the Industry, followed by the set of variables reflecting the aggregated development of economies (Overall Economic Development). Variables from the Trade and Services sectors contribute modestly to the result while Construction makes a slightly negative contribution.
Leading Barometer – regions and sectors
The Leading Global Barometer leads the world economic growth rate cycle by three to six months on average. In November, the Asia, Pacific and Africa region and the Western Hemisphere contribute positively to the aggregate result with 7.3 and 1.6 points, respectively. Europe records a decline of the Barometer, with a negative contribution of 3.2 points to the global indicator, presumably caused by the influence of a looming second wave of Covid-19 in the region. Despite this decrease, Europe still shows the highest level of the three regions.
In November, only the Industry sector contributes to the increase in the aggregate Leading Global Barometer (with 6.5 points). Trade and Construction contribute positively but with little significance to the result, while Services and the set of variables reflecting the aggregated development of economies (Overall Economic Development) contribute negatively to the Global indicator.
The full press release with table and graphs can be found Download here (PDF, 563 KB).
More information on the Global Economic Barometers can be found here.
The Global Economic Barometers
The Global Economic Barometers are a system of indicators enabling timely analysis of global economic development. They represent a collaboration between the KOF Swiss Economic Institute of the ETH Zurich in Switzerland and Fundação Getulio Vargas (FGV), based in Rio de Janeiro, Brazil. The system consists of two composite indicators, the Coincident Barometer and the Leading Barometer. The Coincident Barometer reflects the current state of economic activity, while the Leading Barometer provides a cyclical signal roughly six months ahead of current economic developments.
The two Barometers comprise the results of economic tendency surveys conducted in more than 50 countries with the aim of achieving the broadest possible global coverage. The advantages of economic tendency surveys are that their results are usually readily available and are not substantially revised after first publication.
The Coincident Barometer includes more than 1,000 different time series, while the Leading Barometer consists of over 600 time series. Cross-correlation analysis is used to decide which individual time series are included in the barometers. This involves correlating the individual time series with a reference series. The reference series used is the year-on-year growth rate of global gross domestic product (GDP), where the individual national GDPs are aggregated at purchasing power parity to form global GDP. A time series is only included in a Barometer if it shows a sufficiently high correlation and a suitable synchronization or lead with the reference series. The time period used for this correlation analysis currently runs from January 2010 to December 2019.
The series of the two Barometers are revised each month at publication and are standardized to have a mean of 100 and a standard deviation of 10 for the 10-year period previous to the most recent observations.