Global Barometers rise amid the progress of immunization campaigns against COVID-19
The Global Economic Barometers increase considerably in March, also reflecting the initial success in vaccination programs in some countries and optimism regarding the possibility of achieving control over the pandemic in the coming months. However, the results are still heterogeneous among regions.
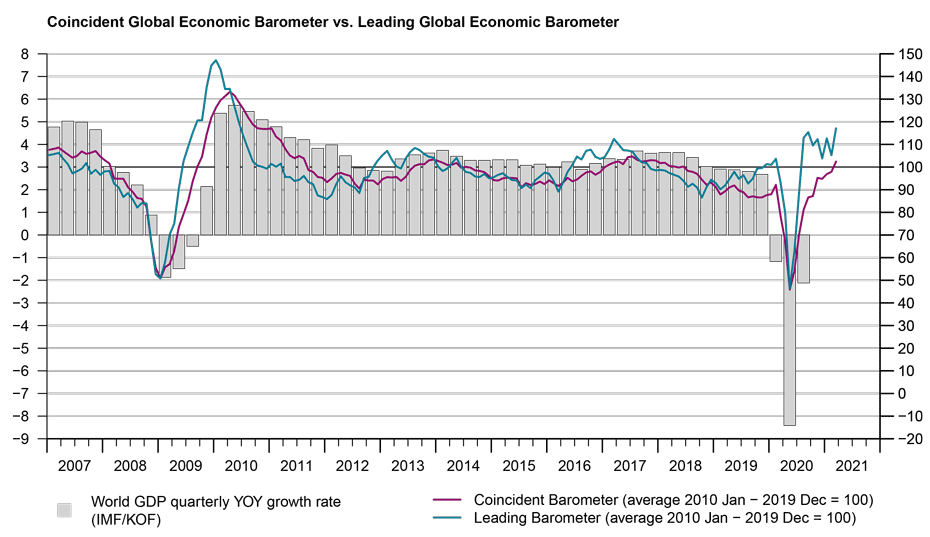
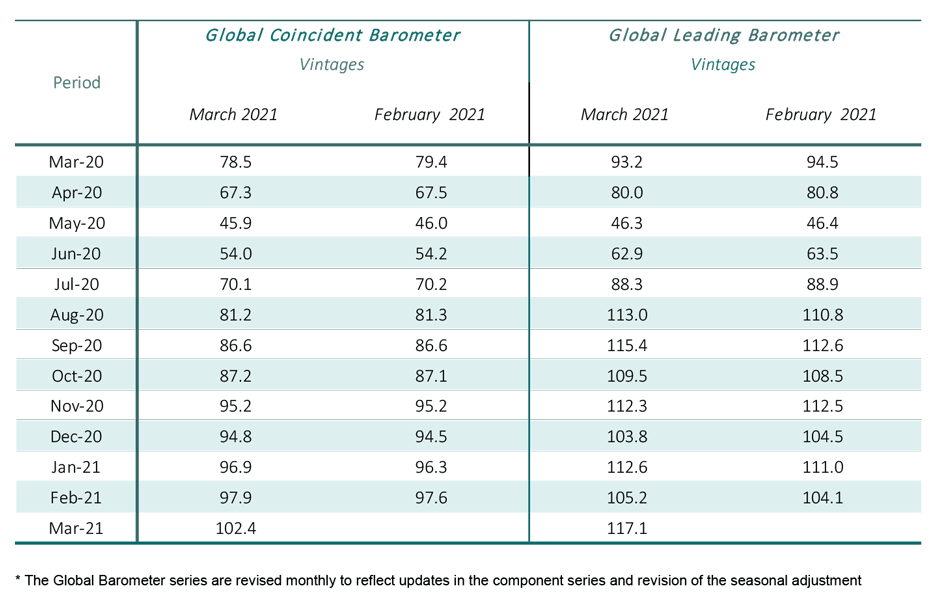
The Coincident Global Barometer rises by 4.5 points in March, from 97.9 points to 102.4 points, reaching its highest level since December 2017. The Leading Global Barometer climbs 11.9 points, to 117.1 points, its highest level since June 2010. Since September 2020, this indicator has remained at a high level, in the range between 104 and 117 points, with fluctuations reflecting alterations in the degree of optimism regarding immunization programs and the difficulties in gaining control over the pandemic in different countries. The Asia, Pacific and Africa region is responsible for almost all of the rise in the global coincident barometer. Within the leading barometer, the Western Hemisphere is moving in the opposite direction to the other regions, contributing negatively to the aggregate result.
“The industrial sector appears to have adapted quite well to the pandemic. It benefits from the fact that at the moment the international flow of goods is practically not restricted by the pandemic. On the other hand, the largely domestic sectors retail and wholesale trade and services in which personal contact is more important still underperform from a longer-term perspective. From a regional perspective it is Europe that is still clearly affected by the pandemic. Asia, on the other hand, is overall in a much better shape”, evaluates Jan-Egbert Sturm, director of KOF Swiss Economic Institute.
Coincident Barometer – regions and sectors
All the regions contribute positively to the aggregate result this month, especially the Asia, Pacific and Africa region, which contributes 4.3 points, or 96%, to the rise in the Coincident Global Barometer, while the Western Hemisphere and Europe contribute only 0.1 points each. Europe is the region recovering most slowly, followed by the Western Hemisphere, reflecting uncertainty there about pandemic control and the speed of vaccination campaigns. The graph below illustrates the contribution of each region to the deviation of the Coincident Barometer from the historical average of 100 points.
The largest positive contribution comes from Industry, followed by the set of variables reflecting the aggregated development of economies (Overall Economic Development). These two are also the only sectorial aggregation levels with indicators already above the long-run average level of 100 points. Among the five sectors, only retail and wholesale Trade contributes negatively to the aggregate result, while the remaining sectors record an increase for the month.
Leading Barometer – regions and sectors
The Leading Global Barometer leads the world economic growth rate cycle by three to six months on average. As with the Coincident Barometer, the Asia, Pacific and Africa region stands out in March, contributing 9.4 points, almost 80%, to the rise in the aggregate indicator. Europe also contributes positively this month, with 2.9 points, while the Western Hemisphere moves in the opposite direction to the other regions, contributing negatively by 0.4 points.
All the Leading Barometer sectors increase this month, influenced by the continuity of vaccination campaigns around the world and the possibility of a return to economic normality in the following months. The set of variables reflecting the aggregated development of economies (Overall Economic Development) and Industry remain the most optimistic sectors (with 123.3 and 117.3 points, respectively). The set of variables reflecting Services rises this month, above its long-term average. Compared to the other sectors, however, the outlook is rather cautiously optimistic.
In March, all the Leading sectorial Barometers contribute positively to the aggregate result. Industry and the set of variables reflecting the aggregated development of economies (Overall Economic Development) contribute 5.1 and 4.0 points, respectively. The other sectors contribute more modestly to the aggregate result.
The full press release with table and graphs can be found Download here (PDF, 522 KB).
More information on the Global Economic Barometers can be found here.
The Global Economic Barometers
The Global Economic Barometers are a system of indicators enabling timely analysis of global economic development. They represent a collaboration between the KOF Swiss Economic Institute of the ETH Zurich in Switzerland and Fundação Getulio Vargas (FGV), based in Rio de Janeiro, Brazil. The system consists of two composite indicators, the Coincident Barometer and the Leading Barometer. The Coincident Barometer reflects the current state of economic activity, while the Leading Barometer provides a cyclical signal roughly six months ahead of current economic developments.
The two Barometers comprise the results of economic tendency surveys conducted in more than 50 countries with the aim of achieving the broadest possible global coverage. The advantages of economic tendency surveys are that their results are usually readily available and are not substantially revised after first publication.
The Coincident Barometer includes more than 1,000 different time series, while the Leading Barometer consists of over 600 time series. Cross-correlation analysis is used to decide which individual time series are included in the barometers. This involves correlating the individual time series with a reference series. The reference series used is the year-on-year growth rate of global gross domestic product (GDP), where the individual national GDPs are aggregated at purchasing power parity to form global GDP. A time series is only included in a Barometer if it shows a sufficiently high correlation and a suitable synchronization or lead with the reference series. The time period used for this correlation analysis currently runs from January 2010 to December 2019.
The series of the two Barometers are revised each month at publication and are standardized to have a mean of 100 and a standard deviation of 10 for the 10-year period previous to the most recent observations.