Global Barometers continue to increase
The Global Economic Barometers increase markedly for the second successive month. This reflects, among other things, the progress in vaccination programs against COVID-19 in various countries and thus the perspective of accelerating the level of global activity in the coming months. This month, all investigated regions improve both their current assessment of the situation and their expectations for the near future.
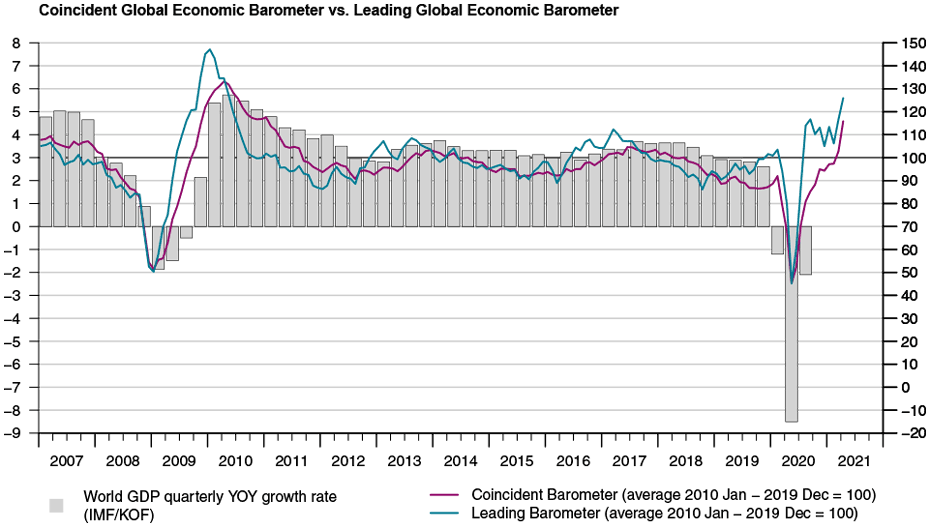
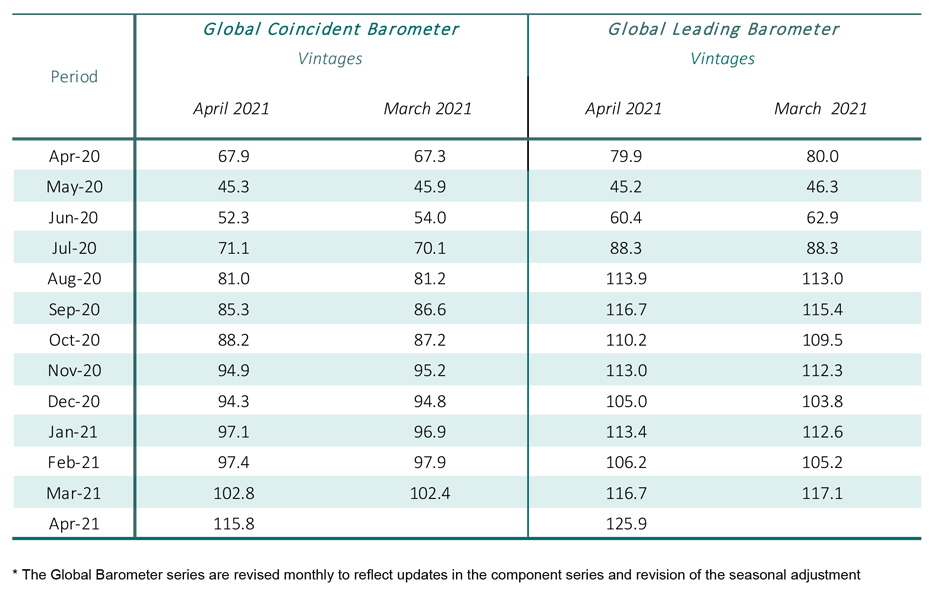
The Coincident Global Barometer rises by 13.0 points in April, from 102.8 points to 115.8 points, reaching its highest level since 2011. The Leading Global Barometer increases 9.2 points, to 125.9 points, its highest level since June 2010. All regions developed positively this month, both regarding the assessment of the present situation and the expectations for the near future.
“Despite Variants of Concern of the virus creating new waves of the pandemic in several countries, firms are confident that the economic recovery can and will continue. Apparently, the world economy has become more resilient with respect to the virus.”, evaluates Jan-Egbert Sturm, Director of KOF Swiss Economic Institute.
Coincident Barometer – indicators of regions and sectors
All the regions contribute positively to the aggregate result of the Coincident Barometer in April. The Asia, Pacific and Africa region contributes 6.8 points, or 52%, to the rise in the Coincident Global Barometer, while the Western Hemisphere and Europe contribute 3.9 and 2.4 points, respectively. Despite the still high levels of uncertainty regarding the COVID-19 pandemic, assessment of the present situation is appreciably brighter. The graph below illustrates the contribution of each region to the deviation of the Coincident Barometer from the historical average of 100 points.
All five sectors identified contribute positively to the aggregate result. The largest contributions come from the set of variables reflecting the aggregated development of economies (Overall Economic Development), followed by Industry. This is the first time since 2017 that all five subindicators are above the level of 100 points (long-run neutrality).
Leading Barometer – indicators of regions and sectors
The Leading Global Barometer leads the world economic growth rate cycle by three to six months on average. Like the Coincident Barometer, in April 2021, the leading indicators of the three regions each contribute positively to the 9.2-point rise in the Leading Global Barometer. The Asia, Pacific and Africa contributes 4.7 points, Europe 2.5 points, and, after negatively influencing the aggregate result in the two previous months, the Western Hemisphere contributes 2.0 points.
All the Leading Barometer sectors increase in April, influenced by the continuity of vaccination campaigns around the world and the possibility of the economy returning to a situation of normality. With the results, all five sectors record levels above 120 points, reflecting a highly optimistic economic outlook regarding the near future. Construction and Trade are the most optimistic sectors. After the big blow to the Services sector, this is the first time that the sector has, globally, recovered the losses incurred between March and May of last year, advancing to a higher level than that of Industry.
In April, all five identified sectors contribute positively to the aggregate result of the Leading Barometer, with Trade and Industry contributing more than 2.0 points. The other sectors contribute over 1.5 points each to the aggregate result.
The full press release with table and graphs can be found Download here (PDF, 580 KB).
More information on the Global Economic Barometers can be found here.
The Global Economic Barometers
The Global Economic Barometers are a system of indicators enabling timely analysis of global economic development. They represent a collaboration between the KOF Swiss Economic Institute of the ETH Zurich in Switzerland and Fundação Getulio Vargas (FGV), based in Rio de Janeiro, Brazil. The system consists of two composite indicators, the Coincident Barometer and the Leading Barometer. The Coincident Barometer reflects the current state of economic activity, while the Leading Barometer provides a cyclical signal roughly six months ahead of current economic developments.
The two Barometers comprise the results of economic tendency surveys conducted in more than 50 countries with the aim of achieving the broadest possible global coverage. The advantages of economic tendency surveys are that their results are usually readily available and are not substantially revised after first publication.
The Coincident Barometer includes more than 1,000 different time series, while the Leading Barometer consists of over 600 time series. Cross-correlation analysis is used to decide which individual time series are included in the barometers. This involves correlating the individual time series with a reference series. The reference series used is the year-on-year growth rate of global gross domestic product (GDP), where the individual national GDPs are aggregated at purchasing power parity to form global GDP. A time series is only included in a Barometer if it shows a sufficiently high correlation and a suitable synchronization or lead with the reference series. The time period used for this correlation analysis currently runs from January 2010 to December 2019.
The series of the two Barometers are revised each month at publication and are standardized to have a mean of 100 and a standard deviation of 10 for the 10-year period previous to the most recent observations.