Global Barometers decline and reinforce normalization tendency in the first quarter of 2022
The Global Economic Barometers are dropping more sharply in March. This partly reflects the normalization of the global economy at the beginning of 2022 and is largely driven by changed assessments in Asia. The coincident indicator remains relatively strong, but the distancing of the leading indicator from the historical mean of 100 points may be a first sign of a stronger deceleration than previously forecast for the coming months.
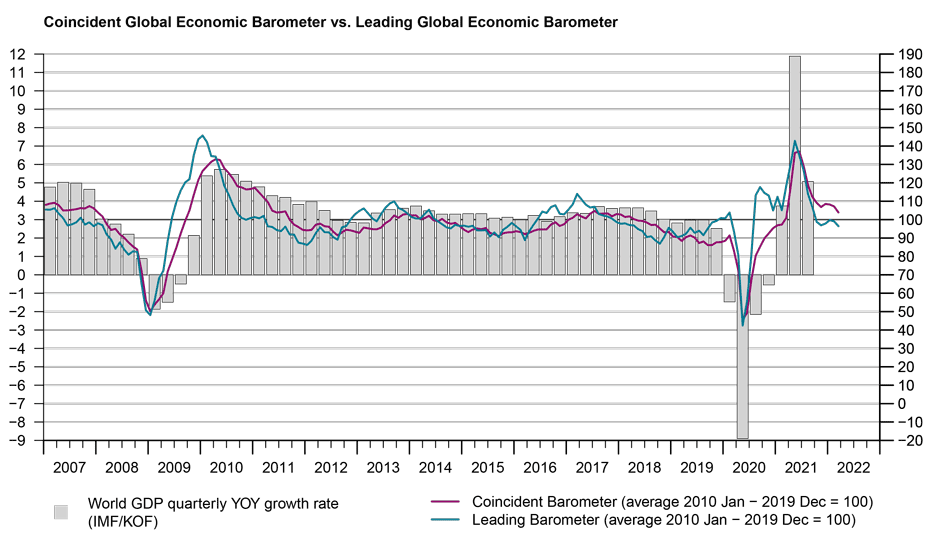
The Coincident Global Economic Barometer falls 3.3 points in March to 103.9 points, the lowest level since March 2021 (100.9 pts), while the Leading Global Economic Barometer decreases 2.7 points, to 96.4 points, the lowest level since July 2020 (80.8 pts). The result of both barometers was strongly influenced by the Asia, Pacific, and Africa region. The data on which the barometers are based are mostly from the period before the outbreak of war in Ukraine. Therefore, this war and the further economic escalation, including renewed price increases for energy commodities, should only be included in the current results to a very limited extent.
“Although there are signs that the pandemic-related supply bottlenecks have eased somewhat, the gloomier economic assessment and outlook in Asia dominate this time. The impact of the Russian invasion of Ukraine on the European and global economies is still barely discernible in these data, as they mostly stem from surveys conducted before the invasion.” comments Jan-Egbert Sturm, Director of KOF Swiss Economic Institute, the latest Global Barometers numbers.
Coincident Barometer – regions and sectors
In March, the Asia, Pacific, and Africa region contributes -3.0 points (93%), to drop in the Coincident Global Barometer. The Western Hemisphere contributes -0.3 points, while Europe´s indicator remains stable this month. The regional indicator for Europe, at a level of 112 points, remains the highest among the three regions. The graph below illustrates the contribution of each region to the deviation of the Coincident Barometer from the historical average of 100 points.
Four of the five coincident sector indicators decrease this month, with Industry and Construction standing out with marginal losses of almost 7.0 points. In the opposite direction, the indicator for Trade records its highest level since May 2021. With this result, the indicator reached 117 points and is the highest among all sectors.
Leading Barometer – regions and sectors
The Leading Global Barometer leads the world economic growth rate cycle by three to six months on average. The Asia, Pacific and Africa region is the only region to contribute negatively to the development of the Leading Barometer in March 2022, with -4.1 points. The Western Hemisphere contributes positively, with 0.9 points, followed by Europe with 0.5 points.
In March 2022, except for Industry, all leading sector indicators decline. Construction records its lowest level since July 2020 (77.9 pts), while the Services sector remains at the opposite side with an indicator still above 100 points.
The full press release with tables and graphs can be found Download here (PDF, 682 KB).
More information on the Global Economic Barometers can be found here.
The Global Economic Barometers
The Global Economic Barometers are a system of indicators enabling timely analysis of global economic development. They represent a collaboration between the KOF Swiss Economic Institute of the ETH Zurich in Switzerland and Fundação Getulio Vargas (FGV), based in Rio de Janeiro, Brazil. The system consists of two composite indicators, the Coincident Barometer and the Leading Barometer. The Coincident Barometer reflects the current state of economic activity, while the Leading Barometer provides a cyclical signal roughly six months ahead of current economic developments.
The two Barometers comprise the results of economic tendency surveys conducted in more than 50 countries with the aim of achieving the broadest possible global coverage. The advantages of economic tendency surveys are that their results are usually readily available and are not substantially revised after first publication.
The Coincident Barometer includes more than 1,000 different time series, while the Leading Barometer consists of over 600 time series. Cross-correlation analysis is used to decide which individual time series are included in the barometers. This involves correlating the individual time series with a reference series. The reference series used is the year-on-year growth rate of global gross domestic product (GDP), where the individual national GDPs are aggregated at purchasing power parity to form global GDP. A time series is only included in a Barometer if it shows a sufficiently high correlation and a suitable synchronization or lead with the reference series. The time period used for this correlation analysis currently runs from January 2010 to December 2019.
The series of the two Barometers are revised each month at publication and are standardized to have a mean of 100 and a standard deviation of 10 for the 10-year period previous to the most recent observations.
The methodology is described in:
Klaus Abberger, Michael Graff, Aloisio Jr. Campelo, Anna Carolina Lemos Gouveia, Oliver Müller and Jan-Egbert Sturm (2020), The Global Economic Barometers: Composite indicators for the world economy. KOF Working Papers, vol. 471, Zurich: KOF Swiss Economic Institute, ETH Zurich, 2020.
Contact
KOF Konjunkturforschungsstelle
Leonhardstrasse 21
8092
Zürich
Switzerland