Global Barometers: negative sequence does not continue in October
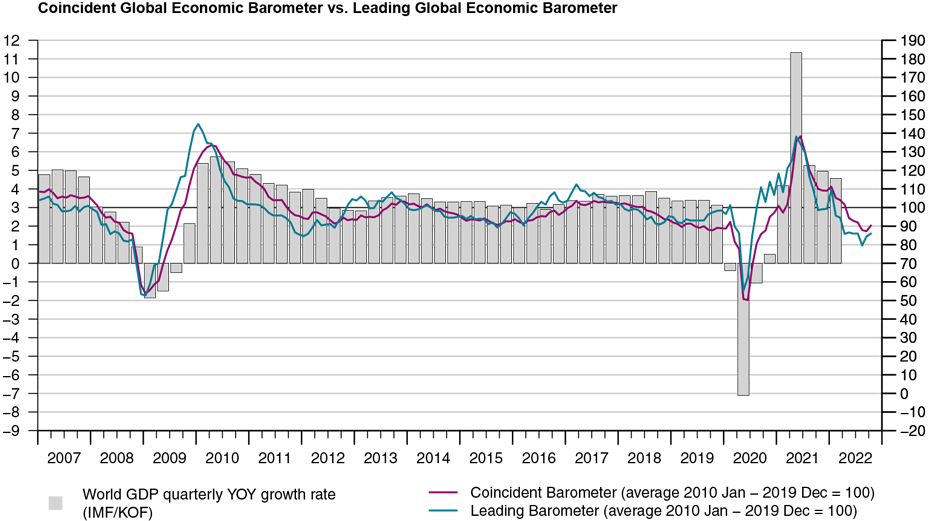
The Coincident Barometer rises after eight consecutive falls and the Leading Barometer increases for the second month in a row. Because the improvement is only modest, the level of the indicators continues to reflect an adverse scenario for world economic growth in the coming months.
In October, the Global Economic Barometers increase simultaneously for the first time since January 2022. The Coincident Global Economic Barometer rises 3.0 points to 90.3 points and the Leading Global Economic Barometer increases 1.5 points to 86.0 points. The rise in the Coincident indicator was driven mainly by the Asia, Pacific & Africa region, while the improvement in the Leading Barometer is the result of improved expectations in the Western Hemisphere and the Asia, Pacific & Africa region.
“Albeit at a low level, the two global barometers did not deteriorate further, but even improved slightly. What is striking is the widening gap between the Asia, Pacific and Africa region on the one hand and Europe and the Western Hemisphere on the other. In the so-called Western world, both the coincident and leading indicators are at significantly lower levels. Above all, but not only, here, both high inflation and the Ukraine war are showing their economic consequences”, comments KOF Director Jan-Egbert Sturm the latest development of the Global Barometers.
“What is striking is the widening gap between the Asia, Pacific and Africa region on the one hand and Europe and the Western Hemisphere on the other.”Jan-Egbert Sturm, Director of KOF Swiss Economic Institute
Coincident Barometer – regions and sectors
In October, the Asia, Pacific & Africa region contributes 3.4 points to the increase in the Coincident indicator, while the Western Hemisphere contributes 0.1 points. Europe, on the other hand, contributes negatively by -0.5 points this month. The regional indicator for Europe has now recorded a sequence of ten consecutive decreases and is at the lowest level among the regions. The worsening in the macroeconomic situation during 2022 and the consequences of the war in Ukraine for the supply of energy in European countries explain the adverse development of the region. The graph below illustrates the contribution of each region to the deviation of the Coincident Barometer from the historical mean of 100 points.
Among the coincident sector indicators, Services increases 17.4 points, Industry climbs 4.0 points, and the indicator for the general state of the Economy (aggregated business and consumer evaluations) gains 0.3 points. Trade and Construction both decrease this month. With this result, Services takes the highest level among the sectors, which has not occurred since November 2021. The distance to the Construction sector reaches almost 30 points.
Leading Barometer – regions and sectors
The Leading Global Barometer leads the world economic growth rate cycle by three to six months on average. In October, the global indicator increases 1.5 points to 86.0 points. The Western Hemisphere and the Asia, Pacific & Africa region contribute positively to the rise in the indicator, with 1.0 and 0.6 points, respectively, while Europe contributes –0.1 points. The indicators for Europe and the Western Hemisphere are more than 20 points below the historic mean of 100 points, portraying a scenario that remains pessimistic for these economies for the coming months.
Among the Leading indicator sectors, Construction, Industry and Services increase this month, while the general state of the Economy (aggregated business and consumer evaluations) and Trade continue in the opposite direction. With this result Trade has the lowest level among the sectors and Construction the highest.

The Global Economic Barometers
The Global Economic Barometers are a system of indicators enabling timely analysis of global economic development. They represent a collaboration between the KOF Swiss Economic Institute of the ETH Zurich in Switzerland and Fundação Getulio Vargas (FGV), based in Rio de Janeiro, Brazil. The system consists of two composite indicators, the Coincident Barometer and the Leading Barometer. The Coincident Barometer reflects the current state of economic activity, while the Leading Barometer provides a cyclical signal roughly six months ahead of current economic developments.
The two Barometers comprise the results of economic tendency surveys conducted in more than 50 countries with the aim of achieving the broadest possible global coverage. The advantages of economic tendency surveys are that their results are usually readily available and are not substantially revised after first publication.
The Coincident Barometer includes more than 1,000 different time series, while the Leading Barometer consists of over 600 time series. Cross-correlation analysis is used to decide which individual time series are included in the barometers. This involves correlating the individual time series with a reference series. The reference series used is the year-on-year growth rate of global gross domestic product (GDP), where the individual national GDPs are aggregated at purchasing power parity to form global GDP. A time series is only included in a Barometer if it shows a sufficiently high correlation and a suitable synchronization or lead with the reference series. The time period used for this correlation analysis currently runs from January 2010 to December 2019.
The series of the two Barometers are revised each month at publication and are standardized to have a mean of 100 and a standard deviation of 10 for the 10-year period previous to the most recent observations.
The methodology is described in:
Klaus Abberger, Michael Graff, Aloisio Jr. Campelo, Anna Carolina Lemos Gouveia, Oliver Müller and Jan-Egbert Sturm (2020), The Global Economic Barometers: Composite indicators for the world economy. KOF Working Papers, vol. 471, Zurich: KOF Swiss Economic Institute, ETH Zurich, 2020.
Contact
KOF Konjunkturforschungsstelle
Leonhardstrasse 21
8092
Zürich
Switzerland