Global Barometers rise again in May
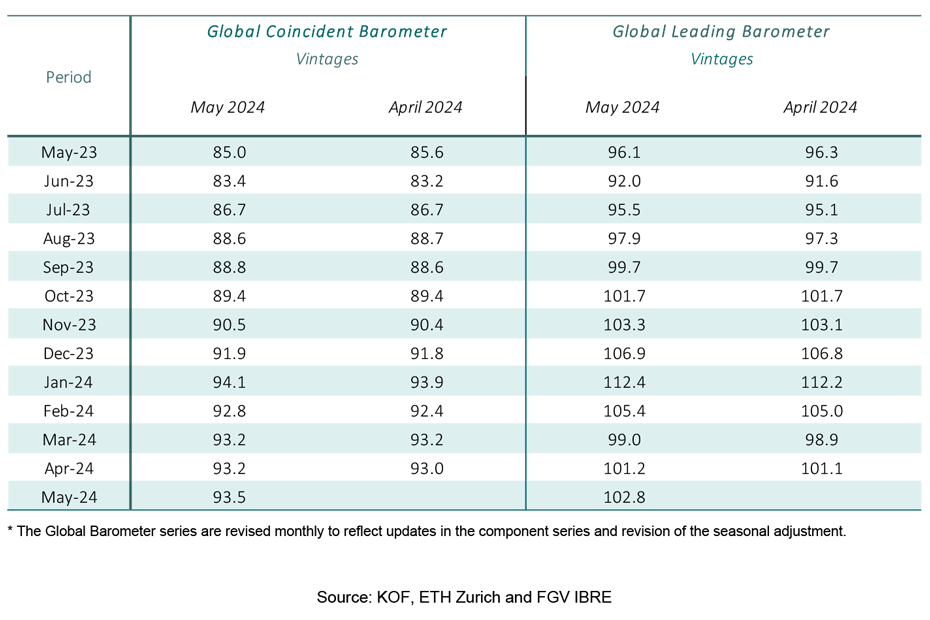
The Leading Global Barometer rises for the second month in a row, but only partially compensating for the losses in February and March. The Coincident Barometer increases marginally this month, remaining within the narrow range of 93 to 94 points observed since February.

The Coincident Global Economic Barometer increases by 0.3 points in May, while the Leading Barometer gains 1.6 points, reaching 93.5 points and 102.8 points, respectively. The slight rise in the Coincident Barometer is mainly due to the improvement in Europe, while the increase in the Leading barometer is driven by rises in the Western Hemisphere and the Asia, Pacific & Africa regions.
“Although risks remain on the geopolitical, inflationary and fiscal fronts, the increases in May in both the coincident and leading global barometers, and the fact that the leading version continues to outperform the coincident version, confirm the scenario of a moderate recovery for the world economy in 2024”, evaluates Jan-Egbert Sturm, Director of KOF Swiss Economic Institute.
“The fact that the leading version of the Global Barometers continues to outperform the coincident version, confirm the scenario of a moderate recovery for the world economy in 2024.”Jan-Egbert Sturm, Director of KOF Swiss Economic Institute
Coincident Barometer – regions and sectors
The slight increase in the Coincident Barometer in May is the result of positive contributions from Europe and the Asia, Pacific & Africa region of 0.2 and 0.1 points, respectively, and a zero contribution from the Western Hemisphere. Since its peak in January, the indicator for the Asia, Pacific & Africa region has shown some volatility, but overall it has declined slightly. In contrast, the indicators for the Western Hemisphere and Europe have been more consistent over the same period. The former has recorded five consecutive increases and is at a higher level than the other regions. All the regional coincident indicators continue to fluctuate within the 90-100 point range, signalling a moderate level of global economic activity. The graph below shows the contribution of each region to the deviation of the Coincident Barometer from its historical average of 100 points.
The development of the Coincident sector indicators in May is heterogeneous, with increases in Construction, Industry and Services, and decreases in Economy (aggregated business and consumer evaluations), and Trade. With these results, Industry remains at the highest level among the sectors and Construction at the lowest.

Leading Barometer – regions and sectors
The Leading Global Barometer leads the world economic growth rate cycle by an average of three to six months. In May, the Asia, Pacific & Africa region and the Western Hemisphere contribute 1.3 and 0.7 points, respectively, to the increase in the global indicator, while Europe records a negative contribution of -0.4 points. The indicator for the Asia, Pacific & Africa region makes gains for the second consecutive month, approaching 102 points and the indicators for the other regions. This reflects a degree of optimism well below the peak of almost 117 points reached by the same indicator in January 2024.
In May, among the Leading sector indicators, those for Economy (aggregated business and consumer evaluations), Services, and Construction increase. However, the indicator for Trade returns to a downward movement, while the indicator for Industry remains relatively stable, with a slight negative change.
The Global Economic Barometers
The Global Economic Barometers are a system of indicators enabling timely analysis of global economic development. They represent a collaboration between the KOF Swiss Economic Institute of the ETH Zurich in Switzerland and Fundação Getulio Vargas (FGV), based in Rio de Janeiro, Brazil. The system consists of two composite indicators, the Coincident Barometer and the Leading Barometer. The Coincident Barometer reflects the current state of economic activity, while the Leading Barometer provides a cyclical signal roughly six months ahead of current economic developments.
The two Barometers comprise the results of economic tendency surveys conducted in more than 50 countries with the aim of achieving the broadest possible global coverage. The advantages of economic tendency surveys are that their results are usually readily available and are not substantially revised after first publication.
The Coincident Barometer includes more than 1,000 different time series, while the Leading Barometer consists of over 600 time series. Cross-correlation analysis is used to decide which individual time series are included in the barometers. This involves correlating the individual time series with a reference series. The reference series used is the year-on-year growth rate of global gross domestic product (GDP), where the individual national GDPs are aggregated at purchasing power parity to form global GDP. A time series is only included in a Barometer if it shows a sufficiently high correlation and a suitable synchronization or lead with the reference series. The time period used for this correlation analysis currently runs from January 2010 to December 2019.
The series of the two Barometers are revised each month at publication and are standardized to have a mean of 100 and a standard deviation of 10 for the 10-year period previous to the most recent observations.
The methodology is described in:
Klaus Abberger, Michael Graff, Aloisio Jr. Campelo, Anna Carolina Lemos Gouveia, Oliver Müller and Jan-Egbert Sturm (2020), The Global Economic Barometers: Composite indicators for the world economy. KOF Working Papers, vol. 471, Zurich: KOF Swiss Economic Institute, ETH Zurich, 2020.
Contact
KOF Konjunkturforschungsstelle
Leonhardstrasse 21
8092
Zürich
Switzerland