
Leading Global Barometer continues to recover
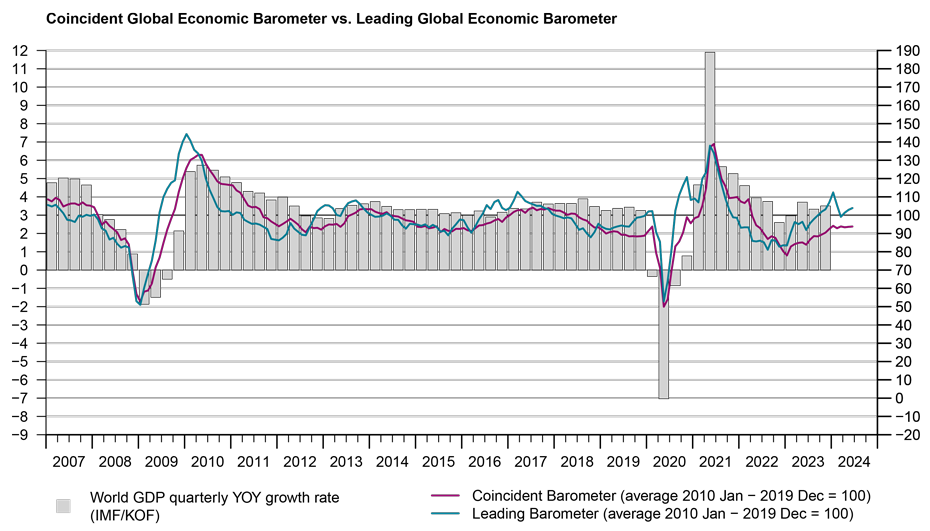
The Leading Global Barometer rises for the third consecutive month in June, but it has not yet fully recovered from the losses of February and March. The Coincident Barometer remains relatively stable for the fourth month in a row.
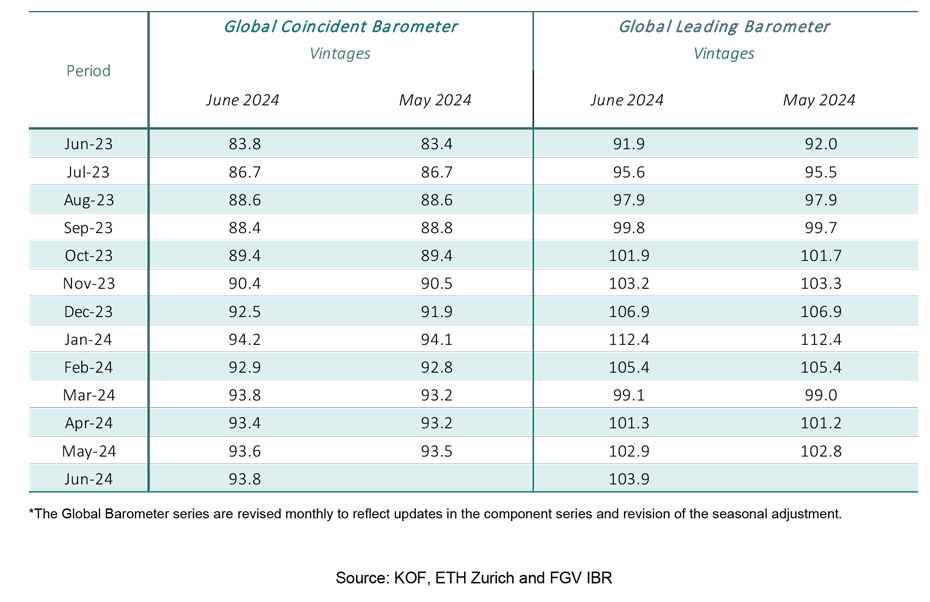
The Coincident Global Economic Barometer increases 0.2 points in June to 93.8 points, while the Leading Barometer gains 1.0 points, reaching 103.9 points. The slight rise in the Coincident Barometer is driven by improvements in Europe and the Western Hemisphere, while the Asia, Pacific & Africa region moves in the opposite direction. However, the increase in the Leading barometer is determined by rises in the Asia, Pacific & Africa region and Europe.
“In many parts of the world, inflation appears to be under control and central banks are gradually beginning to lower interest rates. This bodes well for the outlook for the period ahead. The global leading indicator has been above average since October last year, with the exception of March this year, and has risen for three months in a row this month. The coincident indicator is also improving, albeit at a relatively slow but steady pace, suggesting that economic developments are indeed normalising”, evaluates Jan-Egbert Sturm, Director of KOF Swiss Economic Institute.

“In many parts of the world, inflation appears to be under control and central banks are gradually beginning to lower interest rates. This bodes well for the outlook for the period ahead.”Jan-Egbert Sturm, Director of KOF Swiss Economic Institute
Coincident Barometer – regions and sectors
The slight increase in the Coincident Barometer in June is the result of positive contributions of 0.6 and 0.4 points, respectively, from Europe and the Western Hemisphere, whereas a negative contribution of 0.8 points is recorded from the Asia, Pacific & Africa region. Since the peak in January 2024, the indicator for the Asia, Pacific & Africa region has maintained a decreasing tendency. In contrast, the indicators for the Western Hemisphere and Europe reached their highest level of the last two years in June, with both accumulating gains of more than 15 points in the last 12 months. The graph below illustrates the contribution of each region to the deviation of the Coincident Barometer from the historical mean of 100 points.
The performance of the Coincident sector indicators in June is heterogeneous, with an increase in Trade, a relative stable development in Economy (aggregated business and consumer evaluations) and Industry, and decreases in Construction and Services. Industry remains at the highest level among the sectors and Construction at the lowest.
Leading Barometer – regions and sectors
The Leading Global Barometer leads the world economic growth rate cycle by three to six months on average. In June, Europe and the Asia, Pacific & Africa region contribute 1.0 and 0.3 points, respectively, to the increase in the global indicator, while the Western Hemisphere records a negative contribution of -0.3 points. The indicator for Europe reaches its highest level since October 2021 (108.8 points). It is therefore the region with the most positive outlook.
In June, the Leading sector indicators of Economy (aggregated business and consumer evaluations), Services, Trade, and Industry increase. The only indicator that is decreasing this month, and noticeably so, is Construction.
The Global Economic Barometers
The Global Economic Barometers are a system of indicators enabling timely analysis of global economic development. They represent a collaboration between the KOF Swiss Economic Institute of the ETH Zurich in Switzerland and Fundação Getulio Vargas (FGV), based in Rio de Janeiro, Brazil. The system consists of two composite indicators, the Coincident Barometer and the Leading Barometer. The Coincident Barometer reflects the current state of economic activity, while the Leading Barometer provides a cyclical signal roughly six months ahead of current economic developments.
The two Barometers comprise the results of economic tendency surveys conducted in more than 50 countries with the aim of achieving the broadest possible global coverage. The advantages of economic tendency surveys are that their results are usually readily available and are not substantially revised after first publication.
The Coincident Barometer includes more than 1,000 different time series, while the Leading Barometer consists of over 600 time series. Cross-correlation analysis is used to decide which individual time series are included in the barometers. This involves correlating the individual time series with a reference series. The reference series used is the year-on-year growth rate of global gross domestic product (GDP), where the individual national GDPs are aggregated at purchasing power parity to form global GDP. A time series is only included in a Barometer if it shows a sufficiently high correlation and a suitable synchronization or lead with the reference series. The time period used for this correlation analysis currently runs from January 2010 to December 2019.
The series of the two Barometers are revised each month at publication and are standardized to have a mean of 100 and a standard deviation of 10 for the 10-year period previous to the most recent observations.
The methodology is described in:
Klaus Abberger, Michael Graff, Aloisio Jr. Campelo, Anna Carolina Lemos Gouveia, Oliver Müller and Jan-Egbert Sturm (2020), The Global Economic Barometers: Composite indicators for the world economy. KOF Working Papers, vol. 471, Zurich: KOF Swiss Economic Institute, ETH Zurich, 2020.
Contact
KOF Konjunkturforschungsstelle
Leonhardstrasse 21
8092
Zürich
Switzerland