Global Barometers decline slightly in July
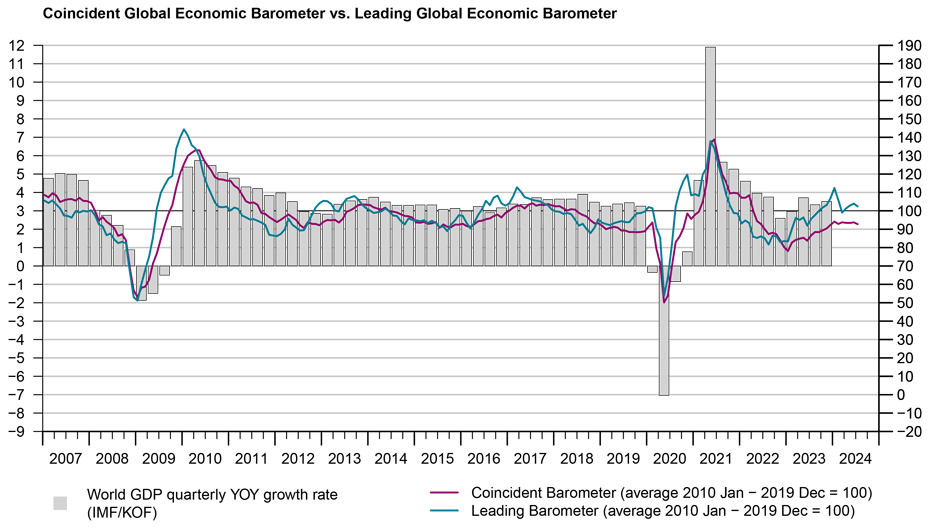
After three consecutive increases, the Leading Barometer fell slightly, although it remained above average. The decline in the Coincident Barometer was even smaller. As a result, the indicator remains within the narrow range in which it has been fluctuating since the beginning of the year. Therefore, the slight decline in the Global Barometers in July currently does not mark a turning point.
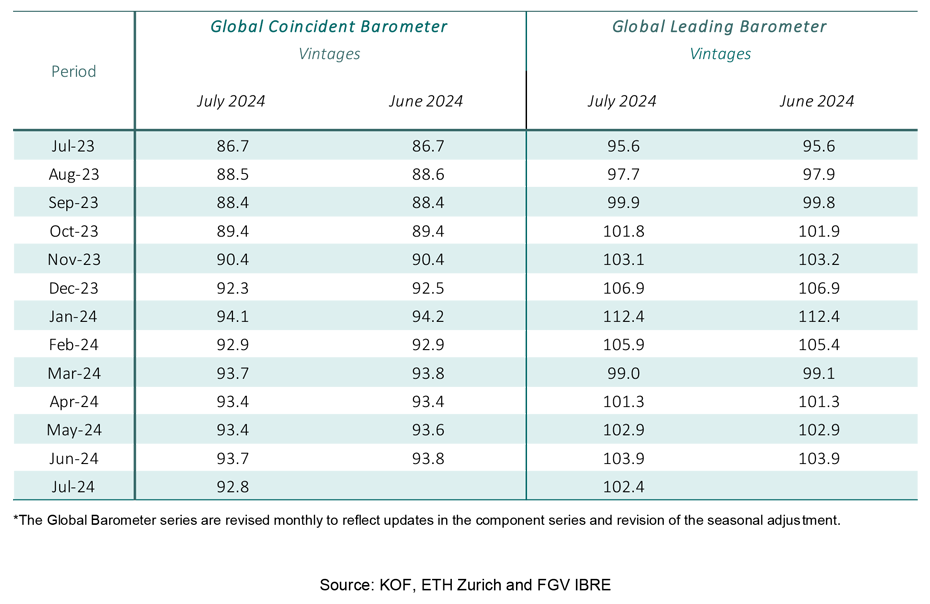
The Coincident Global Economic Barometer decreases 0.9 points in July, to 92.8 points. Meanwhile, the Leading Barometer loses 1.5 points to reach 102.4 points. The fall in the Coincident Barometer is almost entirely driven by the decline in the Asia, Pacific & Africa region. However, the decrease in the Leading barometer is the result of losses in the Asia, Pacific & Africa region and Europe, which counterbalanced by an increase observed in the Western Hemisphere.
“The leading indicator has been above the coincident indicator for more than one and a half years. But the latter has been hovering around the same below-average level of 93 since the end of last year. Despite this month's decline, the outlook remains brighter than the assessment of the current situation. With inflation slowly returning to target and monetary policy thus gradually moving away from its restrictive stance, economic normalisation should indeed be under way”, says KOF Director Jan-Egbert Sturm.

“Despite this month's decline of the Leading Indicator, the outlook remains brighter than the assessment. With inflation slowly returning to target and monetary policy thus gradually moving away from its restrictive stance, economic normalisation should indeed be under way”Jan-Egbert Sturm, Director of KOF Swiss Economic Institute
Coincident Barometer – regions and sectors
The decrease in the Coincident Barometer in July is the result of the 1.0-point negative contribution of the Asia, Pacific & Africa region and a positive contribution of 0.1 points from Europe. The Western Hemisphere records a null contribution. With the decrease, the indicator for the Asia, Pacific & Africa region drops to its lowest level of the year, having accumulated losses of 3.2 points between December 2023 and July 2024. In the same period, indicators for the Western Hemisphere and Europe have shown resilience, accumulating 5.5 and 5.9 points respectively. The graph below illustrates the contribution of each region to the deviation of the Coincident Barometer from the historical mean of 100 points.
The evolution of the Coincident sector indicators in July is predominantly negative, with an increase observed only in Construction. The decreases vary from being mild, as in the case of Economy (aggregated business and consumer evaluations) and Trade, to more accentuated losses, as in Industry and, especially, Services.
Leading Barometer – regions and sectors
The Leading Global Barometer leads the world economic growth rate cycle by three to six months on average. In July, the Asia, Pacific & Africa region and Europe contribute -1.3 and -0.6 points, respectively, to the overall decrease in the global indicator, while the Western Hemisphere records a positive contribution of 0.4 points. Despite the fall in its indicator, Europe remains the region with the most positive outlook.
In July, the Leading sector indicators behave in a similar manner to those of the Coincident indicator, with Construction as the only sector to increase this month. In the other sectors, the falls vary from 1.0 point (Trade) to 8.8 points (Services).
The Global Economic Barometers
The Global Economic Barometers are a system of indicators enabling timely analysis of global economic development. They represent a collaboration between the KOF Swiss Economic Institute of the ETH Zurich in Switzerland and Fundação Getulio Vargas (FGV), based in Rio de Janeiro, Brazil. The system consists of two composite indicators, the Coincident Barometer and the Leading Barometer. The Coincident Barometer reflects the current state of economic activity, while the Leading Barometer provides a cyclical signal roughly six months ahead of current economic developments.
The two Barometers comprise the results of economic tendency surveys conducted in more than 50 countries with the aim of achieving the broadest possible global coverage. The advantages of economic tendency surveys are that their results are usually readily available and are not substantially revised after first publication.
The Coincident Barometer includes more than 1,000 different time series, while the Leading Barometer consists of over 600 time series. Cross-correlation analysis is used to decide which individual time series are included in the barometers. This involves correlating the individual time series with a reference series. The reference series used is the year-on-year growth rate of global gross domestic product (GDP), where the individual national GDPs are aggregated at purchasing power parity to form global GDP. A time series is only included in a Barometer if it shows a sufficiently high correlation and a suitable synchronization or lead with the reference series. The time period used for this correlation analysis currently runs from January 2010 to December 2019.
The series of the two Barometers are revised each month at publication and are standardized to have a mean of 100 and a standard deviation of 10 for the 10-year period previous to the most recent observations.
The methodology is described in:
Klaus Abberger, Michael Graff, Aloisio Jr. Campelo, Anna Carolina Lemos Gouveia, Oliver Müller and Jan-Egbert Sturm (2020), The Global Economic Barometers: Composite indicators for the world economy. KOF Working Papers, vol. 471, Zurich: KOF Swiss Economic Institute, ETH Zurich, 2020.
Contact
KOF Konjunkturforschungsstelle
Leonhardstrasse 21
8092
Zürich
Switzerland