Global Barometers reverse previous month’s losses
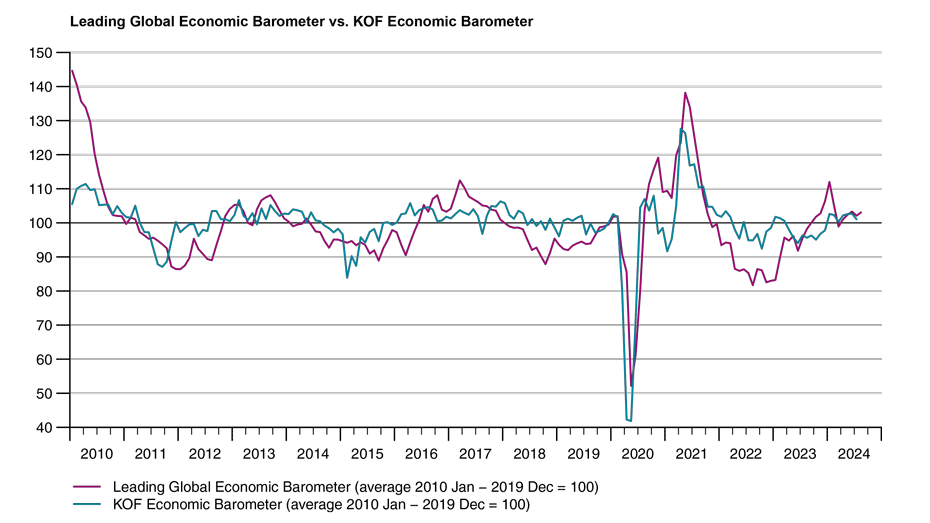
The Global Barometers reverse the previous month’s decline and continue the tendency of relative stability observed in recent months. The Leading Barometer remains above the neutral level of 100 points despite having lost ground earlier this year. The Coincident Barometer, in turn, has remained stable in a narrow band around 94 points since the beginning of the year.
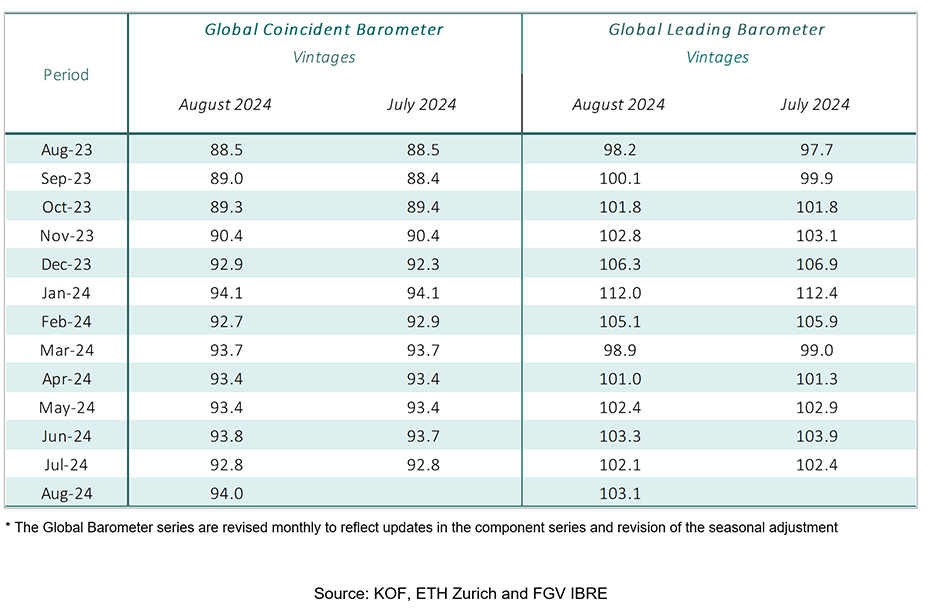
The Coincident Global Economic Barometer increases 1.2 points in August, to 94.0 points, while the Leading Barometer gains 1.0 point, to reach 103.1 points. The increase in the Coincident Barometer is entirely due to the performance of the Asia, Pacific & Africa region, while the increase in the Leading Barometer was driven by gains in Europe and the Western Hemisphere.
“Despite the recent turbulence in the financial markets, triggered by somewhat disappointing US labour market data, the Global Barometers continue to point in the same direction: The situation is below average, while expectations are above average and therefore more positive. This picture is stable and cannot be shaken as quickly as the financial markets, which, despite the correction, still seem to be having a good year. In this sense, the global corrections in the financial markets bring their position more into line with the information underlying the Global Barometers”, says Jan-Egbert Sturm, Director of KOF Swiss Economic Institute.

“The picture which the Global Economic Barometer are drawing is stable and cannot be shaken as quickly as the financial markets. Which, despite the correction, still seem to be having a good year”Jan-Egbert Sturm, Director of KOF Swiss Economic Institute
Coincident Barometer – regions and sectors
The rise in the Coincident Barometer in August is the result of the 1.5-point contribution from the Asia, Pacific & Africa region and the negative contribution of -0.3 points from the Western Hemisphere. Europe records a null contribution. With the increase, the indicator for the Asia, Pacific & Africa region reverses the result of the previous month, when the drop in its indicator had been almost entirely responsible for the decrease in the Coincident Global Barometer. Despite this result, it is still the only region with a negative aggregate for 2024, while Europe and the Western Hemisphere accumulat gains of 5.7 and 4.2 points respectively.
The performance of the Coincident sector indicators in August is varied, with some sectors showing good results and others adverse results. Construction recorded the highest increase for the second consecutive month, followed by Industry. The Services and Economy (aggregated business and consumer evaluations) sectors remain stable, while wholesale and retail Trade is the only sector to achieve a negative result.
Leading Barometer – regions and sectors
The Leading Global Barometer leads the world economic growth rate cycle by three to six months on average. In August, the Western Hemisphere and Europe contribute 0.8 and 0.4 points, respectively, to the increase in the global indicator, while the Asia, Pacific & Africa region records a negative contribution of 0.2 points. The Western Hemisphere reaches its highest level since September 2021 (107.3 pts).
In August, the Leading sector indicators also behave heterogeneously, with Construction and Industry increasing and the other sectors decreasing. Economy and Trade show similar losses of 0.5 points, while the Services indicator falls 2.7 points for the month.
The Global Economic Barometers
The Global Economic Barometers are a system of indicators enabling timely analysis of global economic development. They represent a collaboration between the KOF Swiss Economic Institute of the ETH Zurich in Switzerland and Fundação Getulio Vargas (FGV), based in Rio de Janeiro, Brazil. The system consists of two composite indicators, the Coincident Barometer and the Leading Barometer. The Coincident Barometer reflects the current state of economic activity, while the Leading Barometer provides a cyclical signal roughly six months ahead of current economic developments.
The two Barometers comprise the results of economic tendency surveys conducted in more than 50 countries with the aim of achieving the broadest possible global coverage. The advantages of economic tendency surveys are that their results are usually readily available and are not substantially revised after first publication.
The Coincident Barometer includes more than 1,000 different time series, while the Leading Barometer consists of over 600 time series. Cross-correlation analysis is used to decide which individual time series are included in the barometers. This involves correlating the individual time series with a reference series. The reference series used is the year-on-year growth rate of global gross domestic product (GDP), where the individual national GDPs are aggregated at purchasing power parity to form global GDP. A time series is only included in a Barometer if it shows a sufficiently high correlation and a suitable synchronization or lead with the reference series. The time period used for this correlation analysis currently runs from January 2010 to December 2019.
The series of the two Barometers are revised each month at publication and are standardized to have a mean of 100 and a standard deviation of 10 for the 10-year period previous to the most recent observations.
The methodology is described in:
Klaus Abberger, Michael Graff, Aloisio Jr. Campelo, Anna Carolina Lemos Gouveia, Oliver Müller and Jan-Egbert Sturm (2020), The Global Economic Barometers: Composite indicators for the world economy. KOF Working Papers, vol. 471, Zurich: KOF Swiss Economic Institute, ETH Zurich, 2020.
Contact
KOF Konjunkturforschungsstelle
Leonhardstrasse 21
8092
Zürich
Switzerland