The Countries and the Cities With the Highest Number of Patent Applications
- Innovation
- KOF Bulletin
A new database allows for the geolocation of global patent applications. Thanks to this database, technology clusters can be analysed and patent activities can be compared in different countries and cities. The data are also relevant to policymakers.
So where are new inventions made? To answer this question, KOF researchers joined forces with the “Chair of Innovation and IP Policy” at EPF Lausanne and produced a dataset of worldwide patent applications 1. As a next step, geographic coordinates were assigned to the addresses of the investors and the registered companies and universities (“geocoding”). The dataset contains both the geographic coordinates and the associated cities and regions in which the addresses are located.
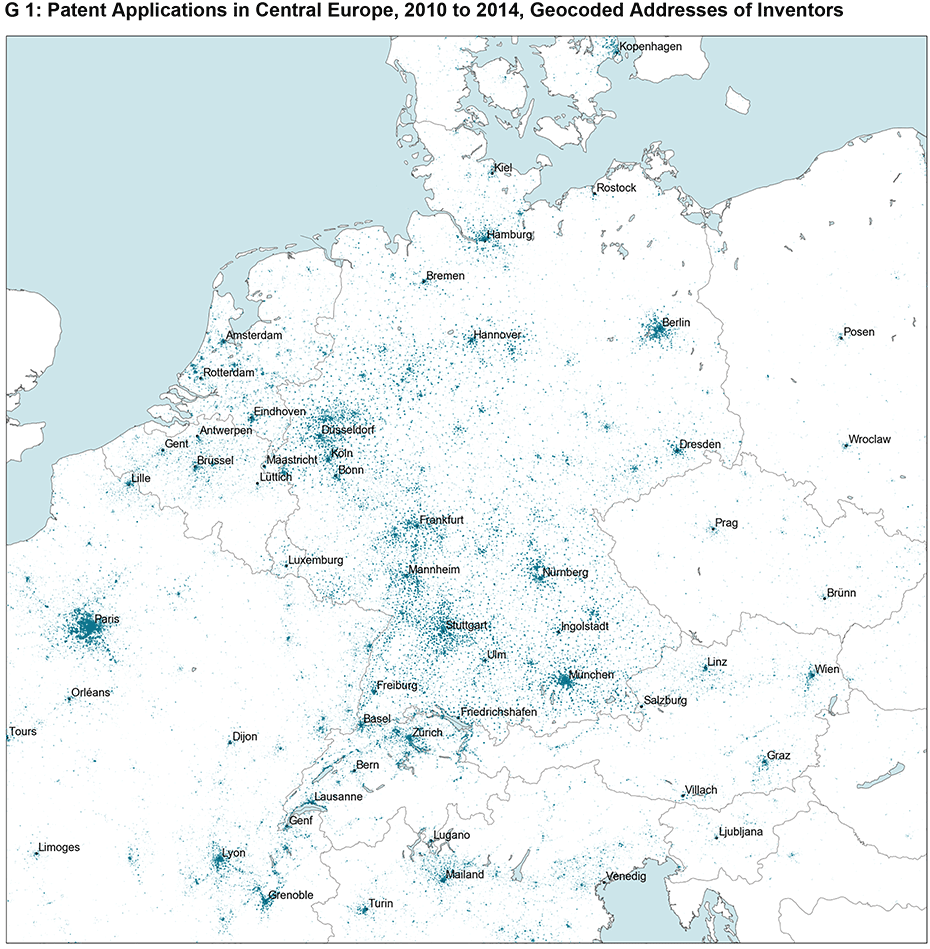
For instance, the database allows for the identification of all patented inventions by inventors based in Zurich or the Canton of Schwyz. A total of 7 million addresses of inventors and applicants were collated from 19 million patent documents, geocoded and assigned to 46 countries and approximately 50,000 cities. Graph 1 maps the inventor coordinates for patent applications in Central European countries.
Original data from the world's main patent offices
Up until now, a comprehensive database containing exact location information for worldwide patent data did not exist. For this project, original data were collected from the five biggest patent offices (US, European, Japanese, Chinese and South Korean patent offices). In addition, the data were supplemented with addresses provided by three national European patent offices (German, UK and French patent offices). Although no further data from patent offices in smaller countries were included, the smaller European countries were also comprehensively covered.
This is mostly due to the fact that small but economically successful countries are highly internationalised, a fact that is also reflected in their patent applications. Many patent applications are filed simultaneously at the national patent office and at patent offices in bigger countries (e.g. Germany or the US) or at the European Patent Office, which standardises the application process within Europe. Address data for smaller countries were taken from the applications filed at other patent offices.
Data for researchers and policymakers
The dataset is predominantly intended for scientists in the fields of innovation economics and economic geography. Exact location data, for instance, enable the accurate measuring of transport and communications costs that arise due to the geographical distance between cooperation and trading partners. A further application consists of the analysis of technology clusters. For instance, there is little evidence regarding the formation of such clusters in emerging markets like China.
Precise geographic information about innovation activities are also very important for policymakers, who are increasingly interested in the location decisions taken by companies and highly-qualified professionals. To this end, it is important to know the location of the main innovation centres. Thanks to the dataset, accurate technology profiles can be produced for each region and city, which then allow for comparative analysis of such regions and cities.
The resulting dataset is available free of charge (see link below). It contains an identification number that tags each patent application, as well as the coordinates of the investor’s domicile and the associated city and country.
Japan and China have the highest number of patent applications
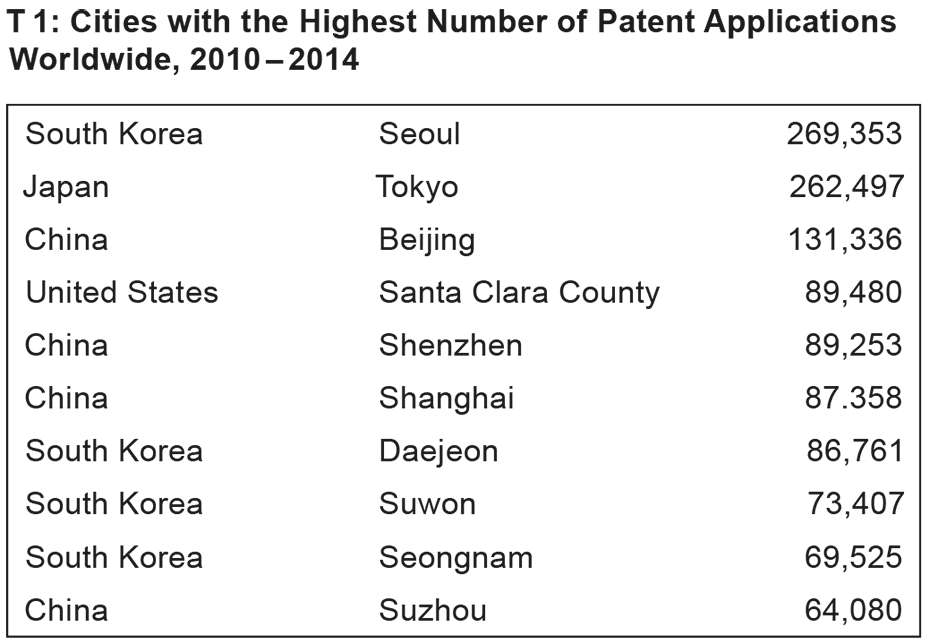
The only non-Asian cluster among the ten biggest patent applicants worldwide is Santa Clara County, the home of Silicon Valley (see Table 1). The first European city is ranked 46th (Munich). However, it is generally difficult to compare Asian and European countries since patent applications are government-subsidised in China and the patent systems are not directly compatible. Nevertheless, looking at Asia’s development over time, it becomes clear that gigantic technological progress has taken place in China: While no more than 5,200 new patent applications were filed in the People’s Republic in 1990, the number had risen to 250,000 in the year 2010.
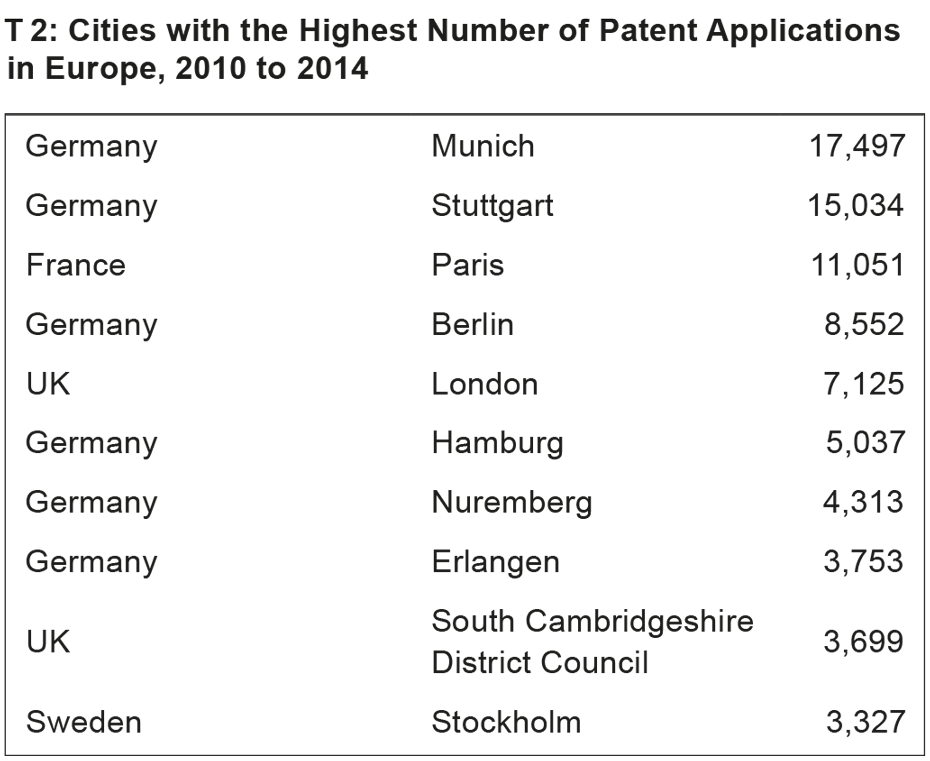
In Europe, the cities with the highest number of patent applications are Munich and – depending on the time frame in question – either Paris or Stuttgart. The European patent statistics are largely dominated by German cities (see Table 2). Helsinki ranks 11th on the list of European cities with the highest numbers of patent applications, while Zurich ranks 12th.
1 The project was funded by the Swiss National Science Foundation (SNF).
---------------------------------------------------------------------------------------------------
A detailed description of the data is available here:
The dataset can be accessed on the KOF website.
Various visualisations for different countries and continents are available on the external page project homepage.
Contact
No database information available