The Global Economic Barometers: current and leading world indicators
- Global Economic Barometers
- KOF Bulletin
KOF has been publishing coincident and leading composite indicators for the global economy every month since January. The two Global Economic Barometers provide timely and highly frequent information. The algorithm used to construct the two barometers is run from the beginning each time. This guarantees the flexibility of the barometer system. At the current edge, the barometers have been quick to identify the economic slump that has accompanied the spread of the coronavirus.
The concept of a global business cycle and the evidence for it have long been discussed in the academic literature. However, it is the effects of the financial crisis of 2007 and the resulting Great Recession of 2009 as well as subsequent events – from the euro crisis and increasingly protectionist tendencies, such as in the United States, to the ongoing COVID-19 pandemic – which have brought the global interdependence of economies more into the public eye than ever before. In contrast to indicators at the country level, however, there are very few indicators for the global economy.
KOF researchers have therefore developed two new composite indicators for the global economy – the Global Barometers – in cooperation with Fundação Getúlio Vargas (Brazil). One of them is designed as a coincident indicator, while the other is intended to anticipate the global economy by several months. Using a large number of underlying variables, these two indicators are able to extract strong signals that dominate the noise in the underlying economic survey data. This eliminates the need for filtering and the associated problems of outlier sensitivity, phase shift and boundary value instability.
Unlike most other composite indicators, where the selection of variables rarely changes, the Global Barometers automatically adapt to changing circumstances. As our pseudo real-time simulations show, these new indicators are often either faster or better at capturing cyclical movements in the global economy than the few other indicators at the global level that are currently available.
The Global Barometers in the coronavirus recession
Let's first take a look at the result: the Global Barometers up to the most recent figures in June. In February 2020, reports began to appear about the out-of-control spread of the coronavirus outside China. Subsequently, measures were taken worldwide to contain the spread of the virus. There have also been changes in behaviour. The Global Barometers should be quick to flag up the resulting restrictions on numerous economic activities.
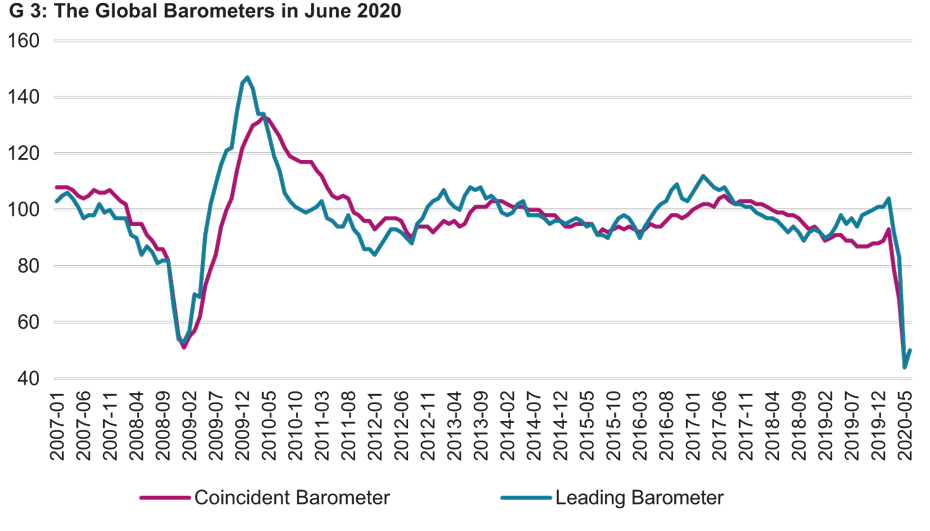
The Global Barometers have been publicly available on KOF’s website on a monthly basis since January this year. Since March, these results have also been described and interpreted in a press release. The first press release in March contained truly dramatic news, with both the leading indicator and the coincident indicator falling by more than ten points each. Both barometers fell well below their historical averages. Chart 3 shows these trends from 2007 onwards and illustrates that the current slump can be compared with the Great Recession of 2008/9. In March the Global Barometers were quick to flag up a global recession that began even more severely than the Great Recession twelve years ago. Although the crisis probably peaked in May, both barometers are still roughly 50 points (i.e. about five standard deviations) below the average for the last ten years, which underlines the dramatic nature of the current situation.
The section below outlines how the barometers are calculated.
Monthly time series for the global economy
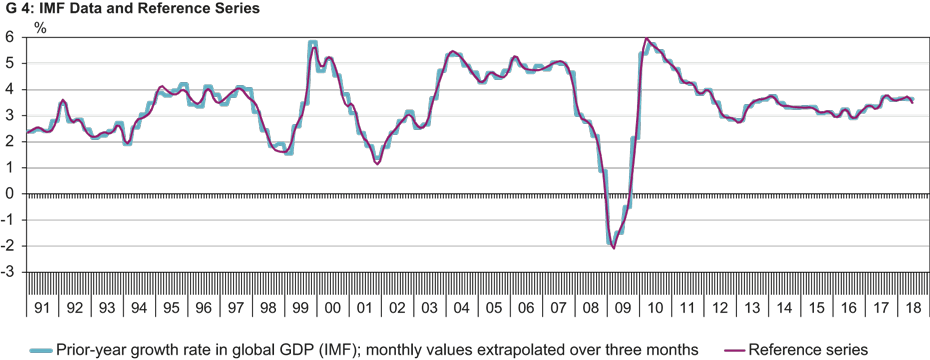
We calculate a monthly time series for the global economy as a reference value with which the barometers are aligned. The International Monetary Fund (IMF) used to publish a quarterly estimate of the growth rate for real world gross domestic product (GDP). However, the IMF's last series dates from the end of 2018 as it has temporarily suspended the publication of this time series. We are therefore extending this series with a KOF estimate based on official national statistics until the IMF resumes its publication. We then construct an index series of real global GDP from these growth rates. After that, we use the additive Denton method to break down the quarterly GDP series into monthly frequencies. From this monthly GDP series we calculate the previous year's growth rate of monthly world GDP as our reference series (see Chart G 4).
1,700 indicators from over 50 countries
Our snapshot of the global economy includes consumer, company and expert surveys from over 50 countries. In total, we have compiled an initial set of almost 1,700 indicators with quarterly or monthly periodicity that we reckon are related to the global economy. We assign the variables to three different regions: Europe, the western hemisphere (American continent, including the Caribbean) and the rest of the world (Asia-Pacific & Africa).
We use a statistical procedure to determine two subgroups from among the indicators. The first group includes those variables that are closely linked to the upswings and downturns of the global economy and are several months ahead of it. The second group includes those variables that move almost in parallel with the global economy. We use another statistical method to combine these two groups of variables into two new variables: the leading and coincident Global Barometers. See the box at the end of this text for more information on the methodology used.
Construction in pseudo real time
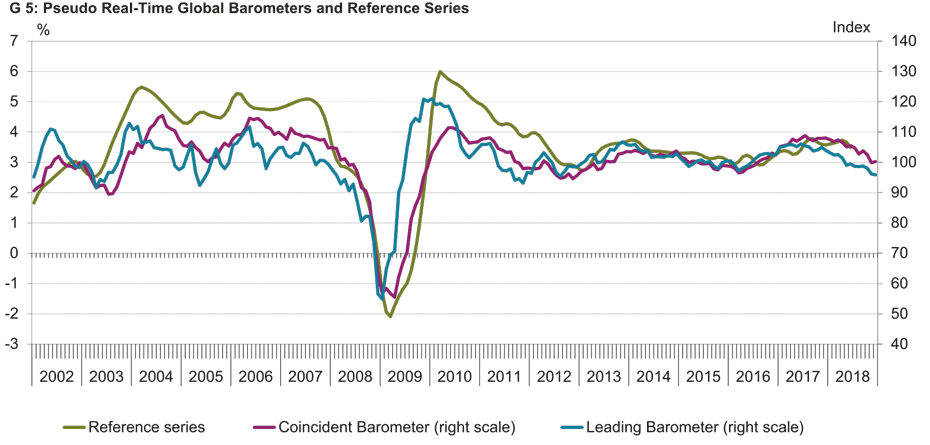
Since we update our calculations every month, the selection of variables and the barometers calculated from them automatically adapt to changing developments and contexts. In order to assess how well the Global Barometers would have reflected the world economic cycle in the past, we simulate both of them in pseudo real time (‘pseudo’ because we do not have real-time publications for the variables and global GDP). Chart 5 shows the simulated Global Barometers together with the reference series. As desired, the leading barometer runs ahead of the reference series and the coincident barometer. However, the leading barometer is noticeably more volatile than the coincident barometer. The ‘price’ of its lead is thus slightly less closely correlated with the global economy.
Further information on methodology
The indicator variables
Before going through the selection procedure, all variables are seasonally adjusted. Depending on the underlying questions, we add transformations of the variables to the initial set. The potential transformations are the logarithm and/or the relevant differences (one-month, three-month or twelve-month differences for monthly variables and one-quarter or four-quarter differences for quarterly variables). For potentially non-stationary variables we only use the differences of the variables. For stationary variables we consider both the levels and differences. In order to ensure the completeness of the data required for our purposes, and based on the experience of the previous year, we move all series with publication delays to the right to the current edge of the time window.
We then calculate the cross-correlations with the reference series for each indicator series. The variable’s time lead over the reference series is identified as the one where the absolute cross-correlation is maximised. The sampling period for calculation of the cross-correlations is set to a rolling window of ten years. This reduces dependence on observations in the distant past and ensures that the variable selection is updated quickly. The end of the ten-year window is set to the month of the last observation of the reference series. This shifts the ten-year window forwards by three months each quarter, i.e. each time our reference series is updated by one quarter.
For a variable to be selected, the lead – where absolute cross-correlation is maximised – must lie within a seven-month window centred on a lead of either zero or six months. In addition, the sign of the correlation for the relevant lead or coincidence must meet economic expectations and pass a 5 per cent significance test, although we perform one-sided tests for variables with theoretically expected signs and two-sided tests for variables with open-ended signs. The selection criteria are applied to all transformations of the same initial variables. If several transformations meet the criteria, only the transformation with the maximum absolute correlation for the targeted coincidence or lead is selected.
Aggregating the indicator variables to construct the Global Barometers
The two selected groups of variables are aggregated using the Partial Least Squares (PLS) method, which determines a small number of ‘factors’ from a larger set of variables, which in turn explain as much as possible of the covariance between the set of variables and the reference series.
Since more than half of the initial variables come from Europe, we use regional weighting to limit this over-representation in the construction of the Global Barometers. To this end, we extract from both the coincident and leading variables one coincident and one leading PLS factor for each of our three regions. The regional PLS factors are aggregated and weighted with the relevant GDP shares. We centre each of the two series on 100, scale them to a standard deviation of ten and thus obtain the Global Barometers.
1) A notable exception is the current KOF Economic Barometer.
2) For the current variables see https://kof.ethz.ch/en/forecasts-and-indicators/indicators/kof-globalbaro.html
3) We use the NIPALS algorithm: Wold, S., A. Ruhe, H. Wold, and W. J. Dunn (1984): The Collinearity Problem in Linear Regression. The Partial Least Squares (PLS) Approach to Generalized Inverses, SIAM Journal on Scientific and Statistical Computing, 5(3), 735─743.
A detailed version of this article can be found in "KOF Analysen" 2/2020.
Contact
Dep. Management,Technolog.u.Ökon.
Weinbergstr. 56/58
8092
Zürich
Switzerland