Comparing Apples to Apples in the Assessment of the Value of Preferential Market Access
- Research Project
- KOF Bulletin
Putting a number on how effective policymakers are in boosting cross-border trade is important. But doing so in a statistically sound way is not trivial. Peter Egger and Filip Tarlea present a new methodology to identify the causal effect of preferential economic integration agreements. Their methodology finds trade effects that are somewhat smaller than predicted by established, but problematic, procedures.
Putting a number on how effective policymakers are in boosting economic outcome is important.[1] Recent academic work has highlighted that participating in preferential economic integration agreements (PEIAs) is beneficial for their members (Frankel et al. 2004, Baier and Bergstrand 2004). In practice, preferential market access can be granted through a preferential trade agreement, a bilateral investment treaty, a double-taxation treaty, or any combination thereof. Countries that are closer to each other – or even share a common land border, have common cultural heritage, or a common language – are predicted to, and have been found more likely to, conclude such agreements. Hence, there is a natural selection of countries into membership of the same agreement. While this is plausible and unanimously accepted in the literature, it makes measuring the impact of PEIAs difficult. Owing to this self-selection problem, a linear empirical specification of trade flows as a function of PEIA indicators – even if conditional on a linear function of the joint drivers of trade flows and PEIA membership – may not reveal the causal partial effect of PEIAs on trade flows.
Recent work suggested that this problem can be avoided by resorting to modern (non-linear, if not non-parametric) estimation techniques. These rely on the idea that the propensity of PEIA membership could be modelled as a function of the joint determinants of, for example, trade flows (or other outcomes) and PEIA membership. As long as it is guaranteed that similarity in this estimated propensity would mean similarity in each and every observable determinant behind it – often referred to as ‘balancing’ – it could be used as a metric to identify similar PEIA members and non-members. In this case, a comparison of economic outcomes of similar members and non-members would reveal the causal partial impact of PEIAs on economic outcome.
In their new work, Peter Egger and Filip Tarlea demonstrate that the commonly used observable variables (such as economic size, distance, etc.) violate the required property of balancing and, hence, that comparing member and non-member country pairs with similar PEIA-membership propensities means comparing apples to oranges (Egger and Tarlea 2017). In fact, they demonstrate that customary procedures of causal-effects estimates of PEIA membership induce a bias of their own, which entirely accrues to the unbalanced nature of the observable PEIA membership determinants.
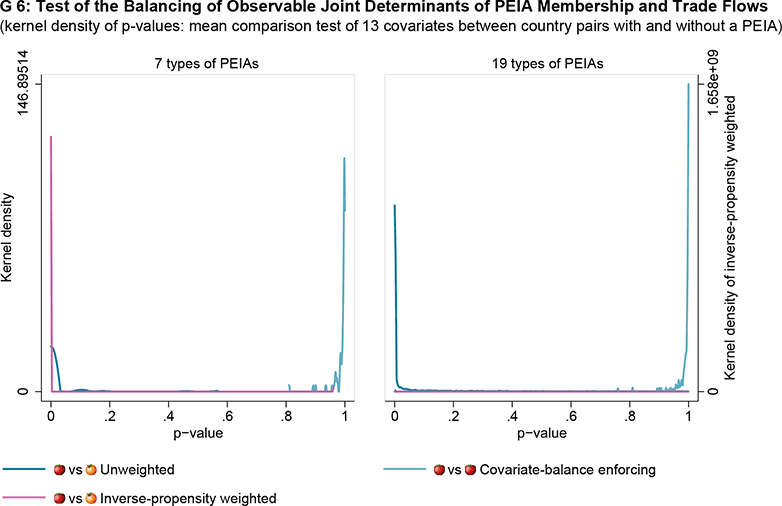
In a sample covering the universe of country pairs over the period 1961-2010, they test the assumption of the balancing of observable joint determinants of PEIA membership and trade flows for seven (and 19, when allowing for different depths of PTA) combinations of PEIAs acting as treatments. They then run – for each year, PEIA treatment, and observable – a mean-comparison test (and also a variance-comparison test) against the null hypothesis of there being no difference in the observables between PEIA members and non-members.
Egger and Tarlea do this with three comparisons: one, where they do not condition on the observables of PEIA membership in any way (this is comparing apples to oranges); a second, where they weight observables inversely by the estimated propensity of PEIA membership (this is still comparing apples to oranges, if the observables for similar-propensity members and non-members are not similar); and a third, where they enforce the similarity for each and every observable determinant of PEIA membership when weighting the data (this is comparing apples to apples). The latter method of balancing-enforcement of the observables employed here relies on so-called entropy balancing introduced by Hainmüller (2012).
Graph G 6 shows an illustration of the outcome of these three test types for mean comparisons of the observables between PEIA members and non-members. As there are 3’757 mean-comparison tests with seven types of PEIAs (and 9’756 such tests for 19 types of PEIAs), the authors plot the distribution (kernel density) of the probability values (p-values). Under the null hypothesis (when one would compare apples to apples), they would expect the tests to be statistically insignificant, shown by a high p-value. The surfaces in Graph X suggest that virtually none of the observable PEIA determinants is unbalanced once balancing is enforced for the observables, while this is not the case for the other procedures. This is obvious from the high propensity of high p-values (no rejection of a comparability of observables between compared PEIA members and non-members) with the green locus relative to the other ones. This suggests that there is a potential problem in earlier work, which did not enforce such balancing of the employed observable characteristics economic outcomes and PEIA membership depend upon.
The authors do not stop here but demonstrate that, in the large dataset at hand, both of the customary methods lead to biased results. The partial effect of any of the seven types of PEIA on trade flows is consistently overestimated by the unweighted estimator, which simply conditions on a log-linear function of the observables when regressing trade flows on PEIA-membership indicators (Graph G 7). The inverse (PEIA-membership) propensity-weighted estimator does not do any better, though. It generates hard-to-believe results, suggesting, for example, that two countries that are in a preferential trade agreement and a bilateral investment treaty at the same time will trade one per cent less than the same two countries if they were in no type of PEIA.
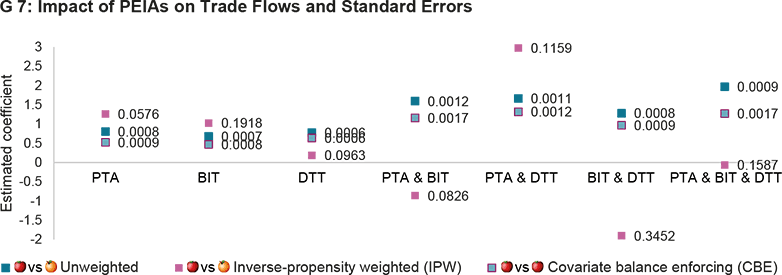
The standard errors around the estimated coefficients of the latter estimator are also by far the largest of all. At 1 per cent, five per cent, or even 10 per cent, all estimated coefficients of the inverse propensity-weighted regression are not statistically significant.
Lastly, Egger and Tarlea assess the quantitative meaning of these estimates in terms of responses of real consumption for each country to PEIA membership – as a utilitarian measure of well-being or welfare (Graph G 8). For this illustration, they use data for the year 2006 to illustrate the relevance of the balancing of the observables. In doing so, they document that the unweighted estimator always overestimates the effect of PEIAs on a country’s welfare. The inverse propensity-weighted estimator, which is not represented in the graphics, does even worse and over- and underestimates treatment effects of PEIAs by a factor of up to 20 and 170, respectively.
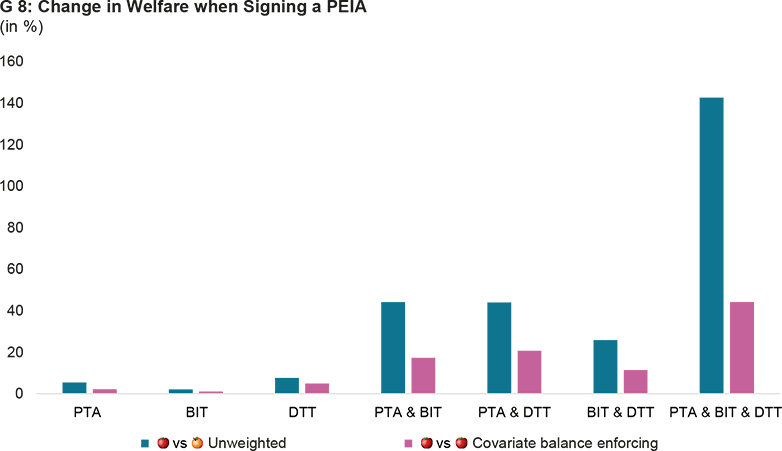
The authors conclude from this analysis that enforcing balancing of observable determinants of PEIA membership is vital for meaningful quantitative assessments of their economic effects, no matter whether economists and policymakers are interested in partial (direct) effects on trade flows or on total ones which take wider adjustments of the economy into account.
[1] This article was originally published on external pagevoxeu.org.
References
Baier, S. L. and J. H. Bergstrand (2004): Economic determinants of free trade agreements. Journal of International Economics 64(1): 29-63, Oktober.
Egger, P. H. and F. Tarlea (2017): Comparing Apples to Apples: Estimating Consistent Partial Effects of Preferential Economic Integration Agreements. CEPR Discussion Paper Nr. 11894.
Frankel, J. A., E. Stein and S-J. Wei (1996): Regional Trading Arrangements: Natural or Supernatural. American Economic Review 86(2): 52-56.
Hainmüller, J. (2012): Entropy balancing for causal effects: A multivariate reweighting method to produce balanced samples in observational studies. Political Analysis 20(1): 25-46.
Contacts
No database information available
No database information available