KOF Economic Forecast: Swiss Economy Faces Tough Conditions
- KOF Bulletin
- KOF Economic Forecasts
KOF has lowered its GDP growth forecast for this year from 1.6% to 1%. This correction is due to the international framework conditions which have deteriorated further in the last few months. In line with the subdued economic outlook, KOF expects the Swiss economy to operate slightly below capacity in 2019.
For the time being, the strong economic trend recorded by Switzerland in 2017 and early 2018 seems to have come to an end. This is largely due to the international environment, which is currently dominated by uncertainty. Cyclical dynamics in the eurozone are likely to be weak in the first six months of 2019 and the economic slowdown looks set to continue in China. The current value of the KOF Economic Barometer, which predicts the performance of the Swiss economy in the near future, is also below average.
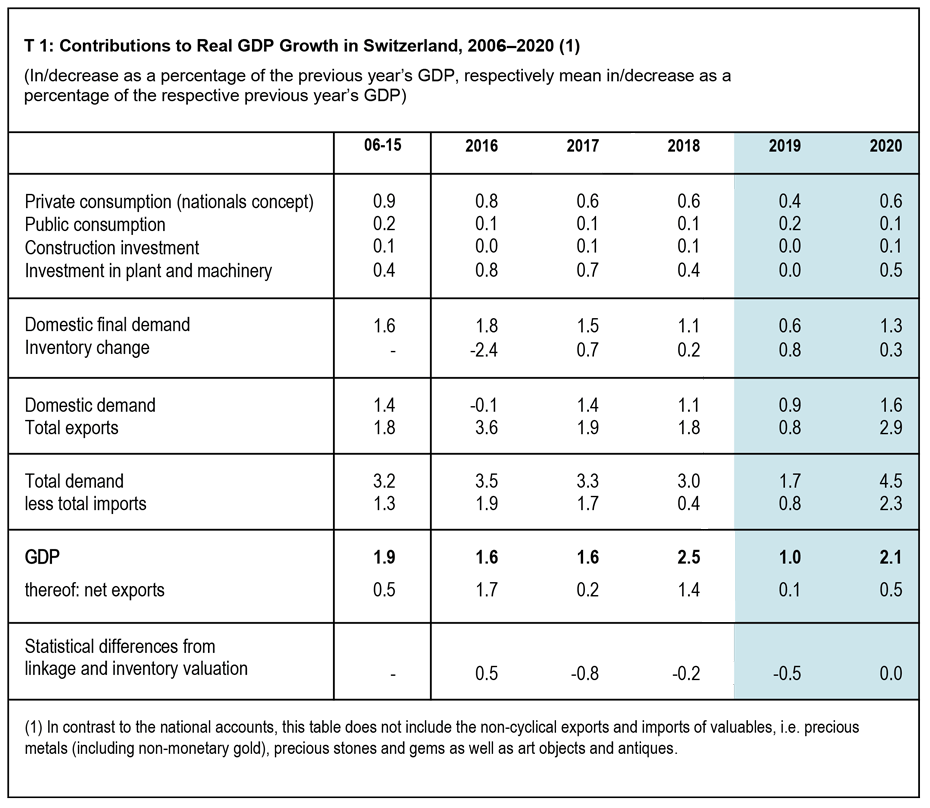
Consequently, KOF has lowered its GDP growth forecast for 2019 from 1.6% to 1% (see T 1). Excluding the effect of licensing income from big international sport events, the respective growth rate for this year declines from 1.8% to 1.3%. At 2.1% (or 1.8% excluding international sport events), projected growth for 2020 remains virtually unchanged from the December forecast.
The weaker international economy also affects export-oriented industrial companies in Switzerland. Industry’s contribution to growth will be significantly lower this year and next year than during the boom year 2018. In the course of 2019, GDP growth will be predominantly lower than the potential growth rate; hence, the annual average output gap will be slightly negative.
Swiss economy at close to full capacity in 2018
The output gap measures the deviation of the realised GDP from the estimated macroeconomic production potential. A positive output gap indicates above-average macroeconomic production capacities, while a negative output gap signals a weak phase of the economy.
Several theoretical approaches are used to calculate the output gap. A popular method is the output approach employed by the EU Commission (EU method) that is binding for all Eurozone member countries. To ensure comparability with the surrounding EU countries, KOF calculates the output gap in accordance with the EU method. The underlying GDP is adjusted for international sport events.
The average annual output gaps recorded by Germany, France, Italy and Switzerland show distinct parallel movements over time (see G 2). For instance, following high production capacity utilisation rates in all four countries in 2008, the financial crisis resulted in a negative output gap in 2009.
The EU Method
According to the EU method, the production potential is broken down into three components: the potential labour volume, the non-financial capital stock and the trend in total factor productivity (TFP). The TFP is calculated as a residual using a Cobb-Douglas production function. It determines the portion of the GDP that cannot be explained by the quantitative use of the labour and capital production factors. The calculation of the labour volume is based on the number of individuals of working age, the net employment rate, the average annual working hours per employed individual and the unemployment rate.

The average annual output gaps recorded by Germany, France, Italy and Switzerland show distinct parallel movements over time (see G 1). For instance, following high production capacity utilisation rates in all four countries in 2008, the financial crisis resulted in a negative output gap in 2009.
In Switzerland, the output gap, which had been consistently negative since 2009, virtually closed in the past year. Hence, with the macroeconomic output rising faster than the production potential, the Swiss economy was operating at close to full capacity in 2018. Given that the expansion rate is lower than the potential growth rate, KOF expects the economy to operate slightly below capacity in 2019, owing to the subdued economic outlook. In 2020, the output gap will narrow to some degree.
In international comparison, the Swiss economy will thus operate at a similar capacity utilisation rate as France in 2019 and 2020, while Germany and Italy are in for slightly higher under-utilisation rates. However, any interpretation of these figures must take into account that potential growth rates may differ substantially from country to country. In 2018 for instance, they varied from just under 2% in Germany to 0.5% in Italy. Switzerland’s 2018 potential growth rate was 1.6%.