Global Barometers settle at moderate levels
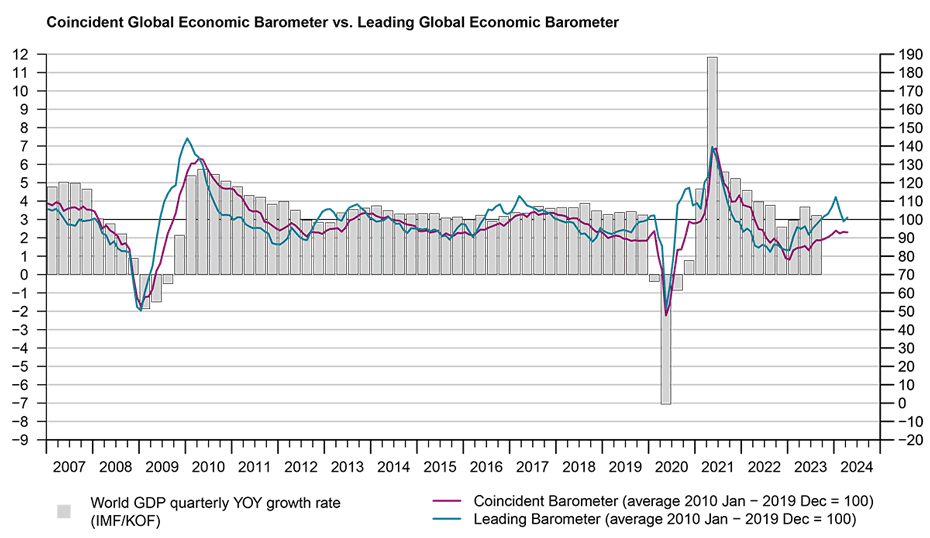
The Leading Global Barometer rises in April, partially offsetting the substantial decline of the previous month to remain close to the neutral level of 100 points. The Coincident Barometer falls slightly this month, confirming that it peaked in January before pointing to a subsequent phase of rather sluggish global economic activity.

The Coincident Global Economic Barometer decreases 0.2 points this month, while the Leading Barometer gains 2.2 points, reaching 93.0 points and 101.2 points, respectively. The slight decrease in the Coincident Barometer is mainly due to by the decrease in the Asia, Pacific & Africa region, while the increase in the Leading barometer is driven by rises in Europe and the Asia, Pacific & Africa region.
“The global barometers show little momentum this month. The outlook remains better than the current assessment, although neither is very positive. In fact, the overall assessment of the current situation remains subdued, while the outlook is about average”, evaluates Jan-Egbert Sturm, Director of KOF Swiss Economic Institute.

“The overall assessment of the current situation remains subdued, while the outlook is about average.”Jan-Egbert Sturm, Director of KOF Swiss Economic Institute
Coincident Barometer – regions and sectors
The slight decrease in the Coincident Barometer in April is the result of negative contribution of 0.4-points negative contribution from the indicator for the Asia, Pacific & Africa region, which is partially offset by positive contributions from the Western Hemisphere and Europe, both of 0.1 points. The regional indicators for Europe and the Asia, Pacific & Africa region remained relatively stable in 2024, cooling off the rate of improvement seen in 2023, when they gained 13.2 and 10.5 points, respectively. In contrast, the Western Hemisphere maintains a tendency of slight increase and remains at the highest level among the regions. All the regional coincident indicators continue to fluctuate in the 90-point band, signalling a moderate level of global economic activity. The graph below illustrates the contribution of each region to the deviation of the Coincident Barometer from its historical mean of 100 points.
The development of the Coincident sector indicators in April is heterogenous, with an increase in Trade, a slight drop in Industry and Economy (aggregated business and consumer evaluations), and more pronounced decreases in Services and Construction. With these results, Industry remains at the highest level among the sectors, followed by Trade.
Leading Barometer – regions and sectors
The Leading Global Barometer leads the world economic growth rate cycle by three to six months on average. In April, Europe and the Asia, Pacific & Africa region contribute 1.2 and 1.0 points, respectively, to the increase in the global indicator, while the Western Hemisphere makes a null contribution. The indicator for the Asia, Pacific & Africa region is still the worst performer in 2024 after having been the regional indicator with the largest gains last year, reflecting reduced optimism. The expectations for Europe and the Western Hemisphere also indicate a slight cooling off of the optimism up to the end of 2023. Nevertheless, all the regional indicators remain above 100 points.
In April, among the Leading sector indicators, Economy (aggregated business and consumer evaluations), Industry, and Trade increase, partially offsetting the declines of the previous two months. The indicator for Construction, however, accentuates the negative tendency after its third consecutive fall to approach the neutral level of 100 points.
The Global Economic Barometers
The Global Economic Barometers are a system of indicators enabling timely analysis of global economic development. They represent a collaboration between the KOF Swiss Economic Institute of the ETH Zurich in Switzerland and Fundação Getulio Vargas (FGV), based in Rio de Janeiro, Brazil. The system consists of two composite indicators, the Coincident Barometer and the Leading Barometer. The Coincident Barometer reflects the current state of economic activity, while the Leading Barometer provides a cyclical signal roughly six months ahead of current economic developments.
The two Barometers comprise the results of economic tendency surveys conducted in more than 50 countries with the aim of achieving the broadest possible global coverage. The advantages of economic tendency surveys are that their results are usually readily available and are not substantially revised after first publication.
The Coincident Barometer includes more than 1,000 different time series, while the Leading Barometer consists of over 600 time series. Cross-correlation analysis is used to decide which individual time series are included in the barometers. This involves correlating the individual time series with a reference series. The reference series used is the year-on-year growth rate of global gross domestic product (GDP), where the individual national GDPs are aggregated at purchasing power parity to form global GDP. A time series is only included in a Barometer if it shows a sufficiently high correlation and a suitable synchronization or lead with the reference series. The time period used for this correlation analysis currently runs from January 2010 to December 2019.
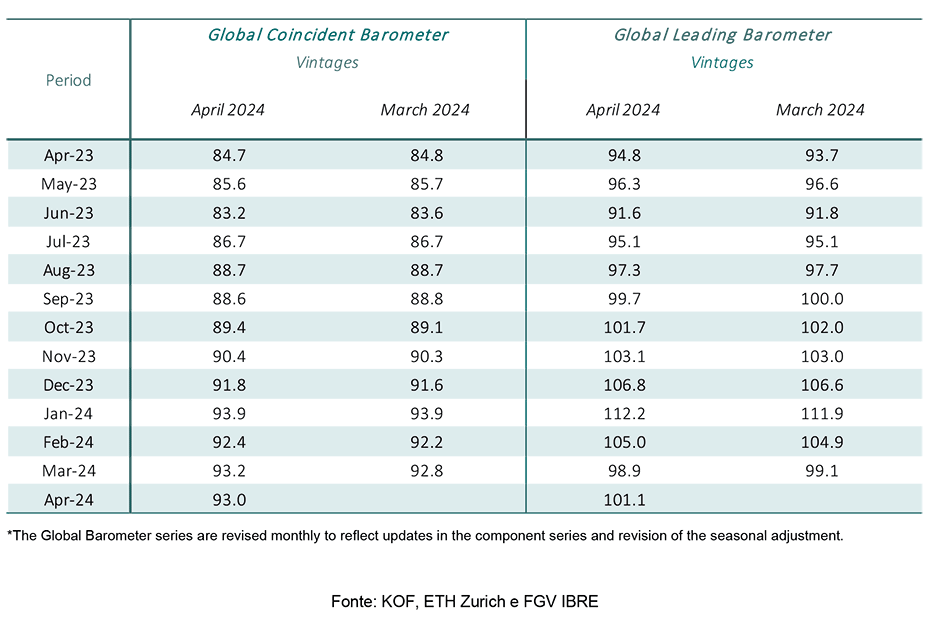
The series of the two Barometers are revised each month at publication and are standardized to have a mean of 100 and a standard deviation of 10 for the 10-year period previous to the most recent observations.
The methodology is described in:
Klaus Abberger, Michael Graff, Aloisio Jr. Campelo, Anna Carolina Lemos Gouveia, Oliver Müller and Jan-Egbert Sturm (2020), The Global Economic Barometers: Composite indicators for the world economy. KOF Working Papers, vol. 471, Zurich: KOF Swiss Economic Institute, ETH Zurich, 2020.
Contact
KOF Konjunkturforschungsstelle
Leonhardstrasse 21
8092
Zürich
Switzerland