The mobility of the Swiss population during the second coronavirus wave
- Swiss Economy
- KOF Bulletin
Social distancing is key to the containment of the coronavirus pandemic. The mobility of the population provides important indications of whether the relevant measures and recommendations are being followed. Analysis of mobility data in Switzerland shows clear differences between the first and second waves. In addition, there are indications that mobility and infection rates influence each other.

Social distancing is a key factor in curbing the spread of the coronavirus pandemic. Although people’s physical mobility does not provide a perfect approximation of the extent of social distancing, it provides one that is good enough.
KOF therefore analyses a wide range of mobility data – including the volumes of traffic on Swiss motorways, the numbers of arrivals and departures at Zurich Airport, train frequencies at Zurich Main Station and nationwide mobility data from Google based on evaluations of smartphones (Google Mobility Report, 2020). Another important data source is COVID-19 mobility monitoring by intervista (intervista, 2020). This company publishes mobility data for a representative sample of the Swiss population every weekday based on smartphone movement data.1
How has mobility changed during the second wave?
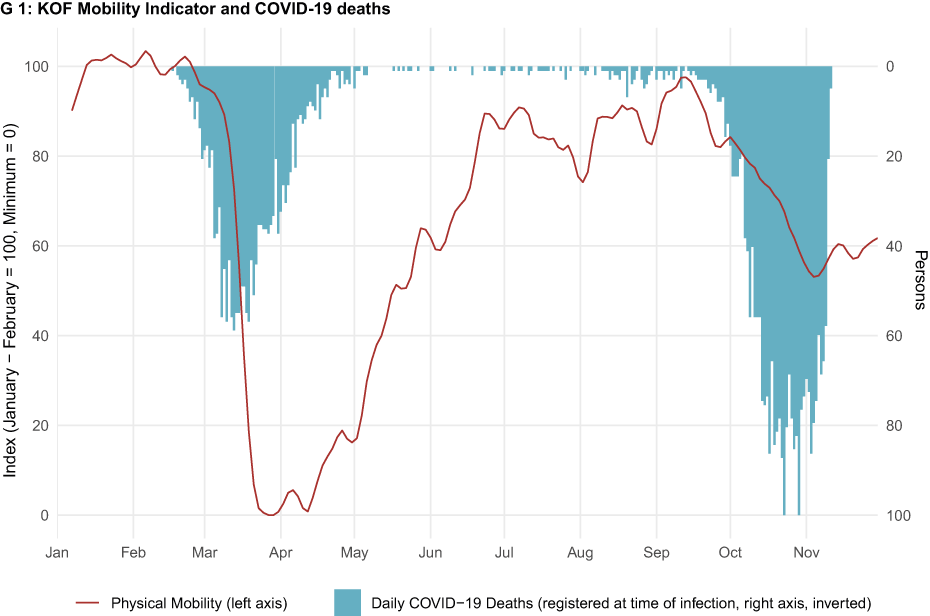
High-frequency mobility data from the various sources often fluctuate sharply, sometimes moving very differently and revealing diverse seasonal patterns. In order to nevertheless extract a common pattern from the data, KOF researchers construct a so-called mobility indicator from the multitude of available data (Eckert and Mikosch 2020). This KOF Mobility Indicator has been made available to the public on a daily basis since March 2020 in the external page KOF High Frequency Economic Monitoring Dashboard(2020) (cf. G 1). The indicator shows that the Swiss population had already significantly reduced their mobility before the shops closed in mid-March 2020, most people started working from home and the public were told to stay at home if possible. Mobility then gradually recovered from the end of April.
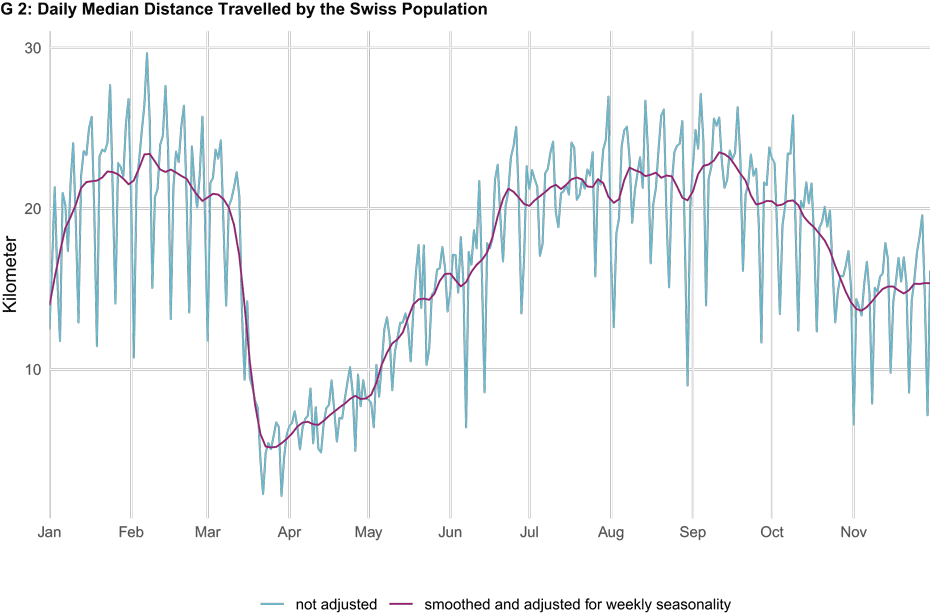
The pattern described above is now being repeated during the second wave.2 This is shown both by the comprehensive KOF Mobility Indicator and the median daily kilometre distance travelled from a representative sample of the Swiss population tracked using smartphone data (see G 2). Mobility decreased as the number of cases rose from September onwards, but so far it has declined much less sharply and more slowly than during the first wave. At the end of March the median distance travelled was just over five kilometres per day; at the beginning of November it was around 14 kilometres per day. Mobility has not decreased any further since the beginning of November. Rather, it has tended to rise again slightly – as it did during the first wave – as the numbers of coronavirus cases have fallen.
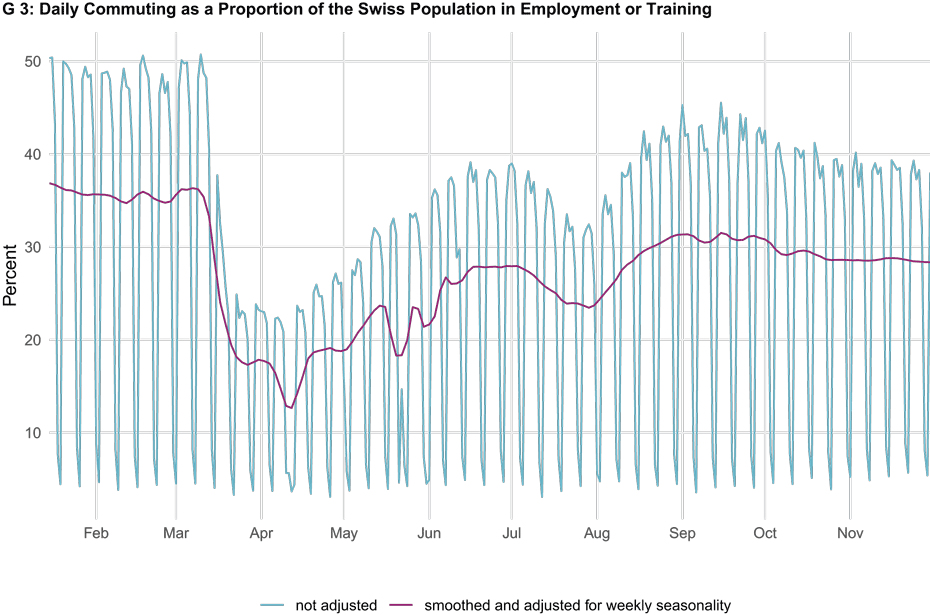
There are likely to be several reasons for the difference in mobility levels between the first and second waves. One reason is that, unlike in March, there has not yet been a tight lockdown. Shops generally remain open and employees continue to commute to work. In addition, politicians’ calls for people to revert to working from home were less urgent than during the first wave. Accordingly, the number of people starting to work from home again is currently much lower than it was in the spring (see G 3).3
Are there differences between the language regions?
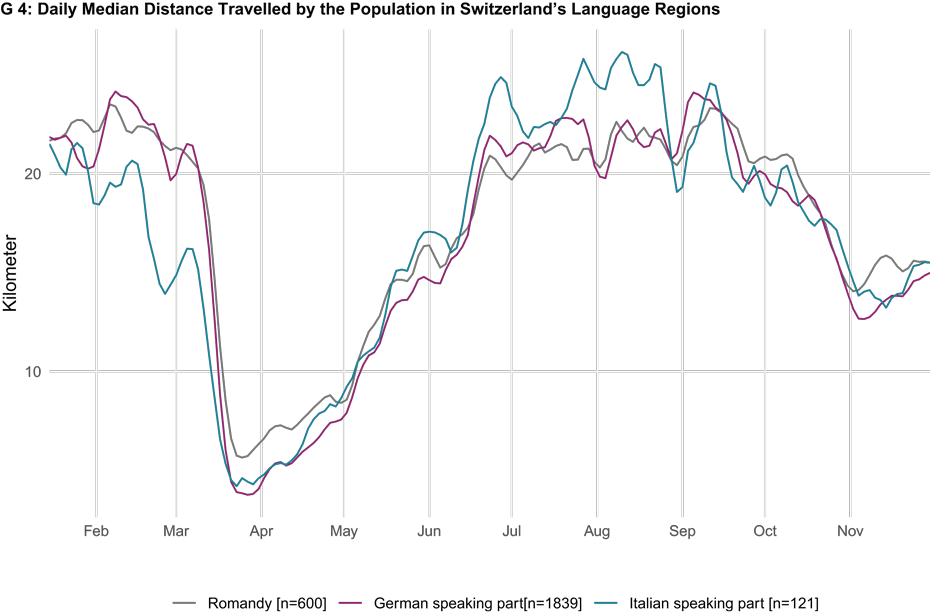
As far as the handling of the coronavirus crisis is concerned, there is currently much talk about the ‘Röstigraben border’ between the French-speaking and German-speaking parts of Switzerland. It is noticeable that there are no significant differences between the language regions in terms of mobility; rather, there is a strong synchronicity here (cf. G 4). However, the time series for Italian-speaking people is based on only 121 tracked individuals and therefore shows a higher fluctuation margin than that of the other two language regions.
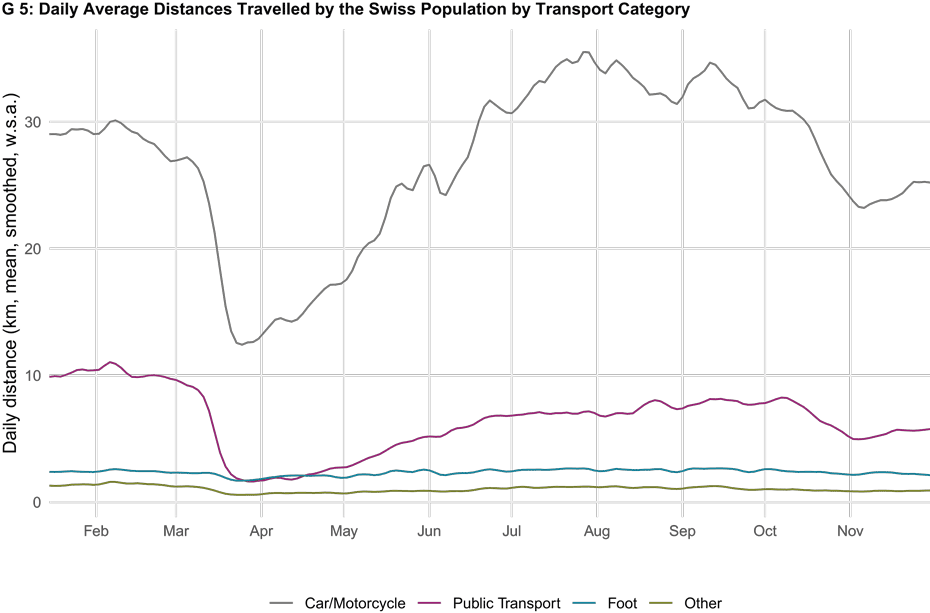
Are there differences between transport categories?
As far as the various modes of transport are concerned, public transport is a particular focus of attention as an increased risk of infection is sometimes suspected here. Chart 5 shows the daily kilometre distances travelled (average values, smoothed and adjusted for weekly seasonality) by the Swiss population in individual transport categories. Not surprisingly, the car plays a dominant role compared with other categories. It is striking that mobility by car and motorbike was higher over the summer months than it had been before the outbreak of the pandemic in January and February 2020, while public transport never regained its pre-crisis levels from the beginning of the year.4
What is the relationship between mobility and coronavirus infections?
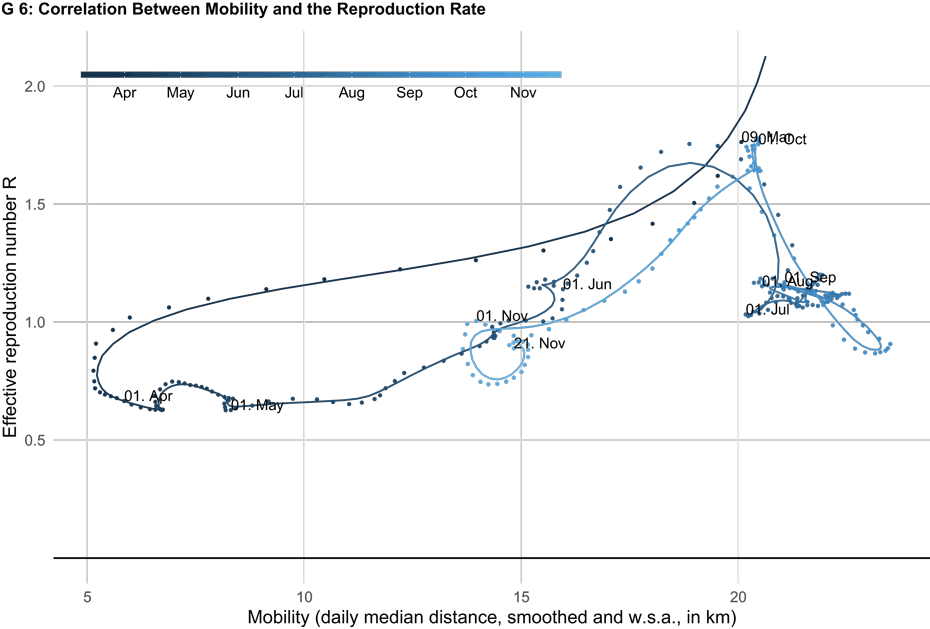
Chart 6 shows the relationship between mobility and the effective reproduction number R over time. Mobility is measured by the daily median distance travelled by the Swiss population. The effective reproduction rate is determined based on confirmed cases (data source: Scrire et al., 2020). The solid line represents the seven-day average. With the exception of the period from July to September there is a clear correlation between the two variables: if one variable decreases (increases) then the other variable decreases (increases).
If the daily effective reproduction number R is regressed to the level of mobility in the days before (one to 14 days’ delay), a significant correlation emerges. This also shows a significant delayed correlation between the number of new infections (instead of R) and mobility. However, this should initially only be interpreted as a correlation and not as a cause. A further Granger causality analysis suggests that causality goes in both directions. On the one hand, mobility is declining because people are more cautious in the face of higher infection rates and because preventive policy measures are restricting mobility. As mobility decreases, on the other hand, the degree of social distancing among the population increases, which slows the spread of the virus.
The full version of this analysis can be found on external page Ökonomenstimme.
-------------------------------------------------------------------
1) The data are published on behalf of StatistikZH, the Swiss National COVID-19 Science Task Force, and KOF.
2) In chart 1 it should be noted that deaths are shifted three weeks into the past, as daily deaths are used here as a proxy for new daily coronavirus infections. Accordingly, no approximate values for new infections are available for the current time span.
3) The proportions of commuters shown in chart G 3 provide only approximate information on the amount of working from home. People who do not commute according to the definition used are – in addition to those working from home – those without a fixed workplace outside their home (e.g. taxi drivers, bus drivers and farmers) and people who are staying at home owing to short-time working, holidays, illness, etc.
4) It is possible that seasonal effects play a role here that cannot be controlled for using the available data.
References
Eckert F. und Mikosch H. (2020): Mobility and Sales Activity During the Corona Crisis, Swiss Journal of Economics and Statistics, 156(9), external page https://doi.org/10.1186/s41937-020-00055-9.
Google (2020): COVID-19 Community Mobility Reports, external page https://www.google.com/covid19/mobility/, Google.
intervista (2020): Mobility Monitoring COVID-19 on behalf of the Statistical Office of the Canton of Zurich, the Swiss National COVID-19 Science Task Force and the KOF Konjunkturforschungsstelle der ETH Zurich, external page https://www.intervista.ch/mobilitaets-monitoring-covid-19/, Bern/Zürich: intervista AG.
KOF High Frequency Economic Monitoring Dashboard (2020): external page https://kofdata.netlify.app, KOF Swiss Economic Institute, ETH Zurich.
Scrire, J., Huisman J. S. , Angst D., Neher R., Leventhal G., Bonhoeffer S., und Stadler T. (2020): https://ibz-shiny.ethz.ch/covid-19-re/, Zurich: ETH Zurich.
StatistikZH (2020): Gesellschaftsmonitoring COVID19, external page https://www.zh.ch/de/news-uebersicht/mitteilungen/2020/politik-staat/statistik/durch-die-krise-begleiten---gesellschaftsmonitoring-covid19-.html, Statistical Office of the Canton of Zurich.
Contact
KOF Konjunkturforschungsstelle
Leonhardstrasse 21
8092
Zürich
Switzerland
KOF Konjunkturforschungsstelle
Leonhardstrasse 21
8092
Zürich
Switzerland