The KOF Weekly GDP Indicator for Switzerland
- Swiss Economy
- KOF Bulletin
Most traditional macroeconomic indicators were not suitable for capturing the drastic economic slump of spring 2020 in a precise and timely manner. This brought into focus the need for high-frequency economic monitoring using alternative data such as credit card transactions. These alternative data sources offer valuable insights but are also fraught with problems.

A number of high-frequency indicators of economic activity emerged last year in the wake of the coronavirus crisis. These included the weekly activity indicators used by the Federal Reserve Bank of New York, the German Bundesbank and the Austrian National Bank. In Switzerland there are the KOF activity indicators and the SECO weekly economic activity index. These indicators are often based on data that otherwise receive little attention in business cycle research: credit card sales, cash withdrawals, energy consumption, personal and public transport volumes, mobility data and internet search queries. These alternative data have some characteristics that make statistical interpretation difficult. For example, observations are often missing, the data are published either irregularly or with a delay, or the surveys take place at daily, weekly or monthly intervals. Moreover, it is unclear how well these indicators correlate with economic activity in normal times – which is also due to the fact that many alternative data have only recently been collected.
There are many differences in the estimation and interpretation of the high-frequency indicators that have been developed on the basis of these alternative data. They often arise from the fact that a common explanatory factor is extracted from the high-frequency series available. This is then scaled to be coherent with GDP growth rates for a reference period. The published indicators often have the interpretation of a previous year's change in GDP. This was useful information at the beginning of the crisis when the previous year's base was stable. At this point in time, which marks the anniversary of the coronavirus crisis, however, the previous year’s changes are becoming more difficult to interpret. Moreover, the high frequency means that traditional macroeconomic data often receive less attention in the high-frequency indicators. However, these have not become fundamentally less reliable; it is just that they were available too late during the coronavirus crisis. Their inclusion in a high-frequency indicator would therefore generally be advantageous.
A dynamic factor model with alternative high-frequency data
Among other things, KOF uses a dynamic factor model for high-frequency economic monitoring in Switzerland, which estimates the weekly change in Switzerland's real GDP (i.e. adjusted for sporting events).1 The high-frequency factor is extracted from an extensive data set. This contains daily and weekly alternative data, but also traditional monthly indicators such as the KOF Business Tendency Surveys, consumer sentiment, retail sales and industrial output. This modelling approach has several advantages. Firstly, data of different frequencies can be considered simultaneously, with temporal restrictions ensuring that the high-frequency factor is correctly explained by indicators with the same or lower frequencies. In addition, the integration of stochastic volatility allows the factor to better pick up the erratic changes at times of crisis. Finally, the model allows for serial correlation in the measurement errors, which increases the precision of the model.
The KOF Weekly GDP Indicator over the last 30 years
Looking at high-frequency data is particularly interesting during periods of sharp cyclical fluctuations. Chart 11 shows the KOF weekly GDP indicator (in German: KOF WBI) since 1990, together with a 95 per cent confidence interval (in blue) and the realised annualised quarter-on-quarter GDP growth rate (in red). The annualised view allows a direct comparison of growth rates with different frequencies.2 Since the coronavirus crisis dwarfs all previous shocks, the sharp vertical swings are truncated in this chart.
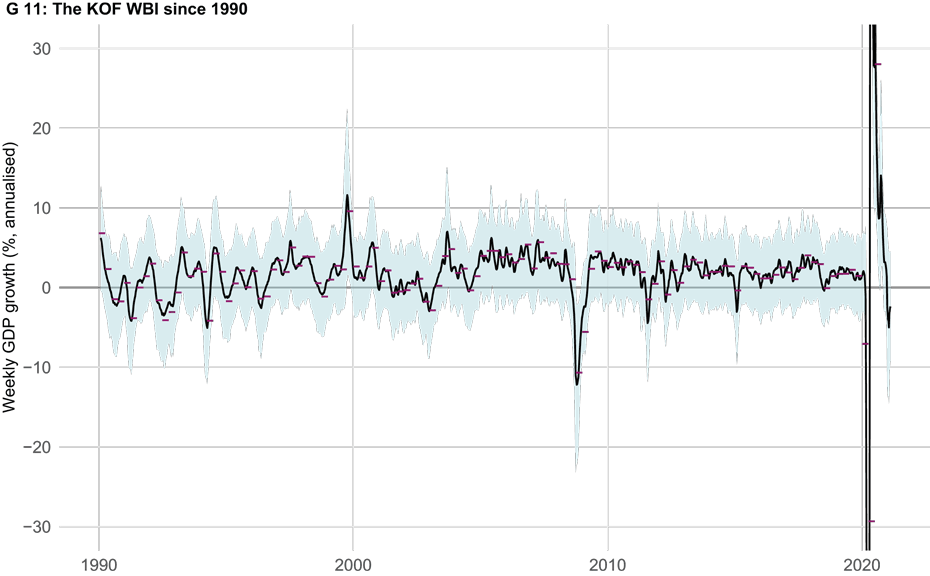
The indicator corresponds ex-post to an interpolation of the quarterly GDP growth rates published by SECO. However, the use of high-frequency indicators here provides interesting insights into short-term trends and turning points. During the financial crisis, for example, the GDP indicator revealed negative growth rates as early as August 2008, hitting a low in mid-November. From March 2009, the weekly growth rate turned positive again. The changes in weekly growth rates show that both the downturn and the subsequent recovery were very abrupt, which cannot be captured by looking at the quarterly figures. On 15 January 2015 the Swiss National Bank unexpectedly suspended the minimum exchange rate of 1.20 Swiss francs per euro. This led to a rapid appreciation of the Swiss franc, which has since been referred to as the ‘franc shock’. GDP fell by 0.7 per cent in the first quarter of 2015 and rebounded by a robust 2.7 per cent in the following quarter. The weekly GDP indicator shows that the economic downturn was relatively sharp immediately after the shock but that a strong recovery had already started by the end of February. This prevented the growth rate for the first quarter of 2015 from becoming even more negative. The indicator also shows that economic activity was fairly flat on average in the second quarter and that the strong quarterly growth rate was primarily due to a substantial statistical overhang from the first quarter. Overall, this analysis shows that the KOF weekly GDP indicator can help us to better understand rapid economic volatility following shocks.
Unprecedented volatility in spring 2020
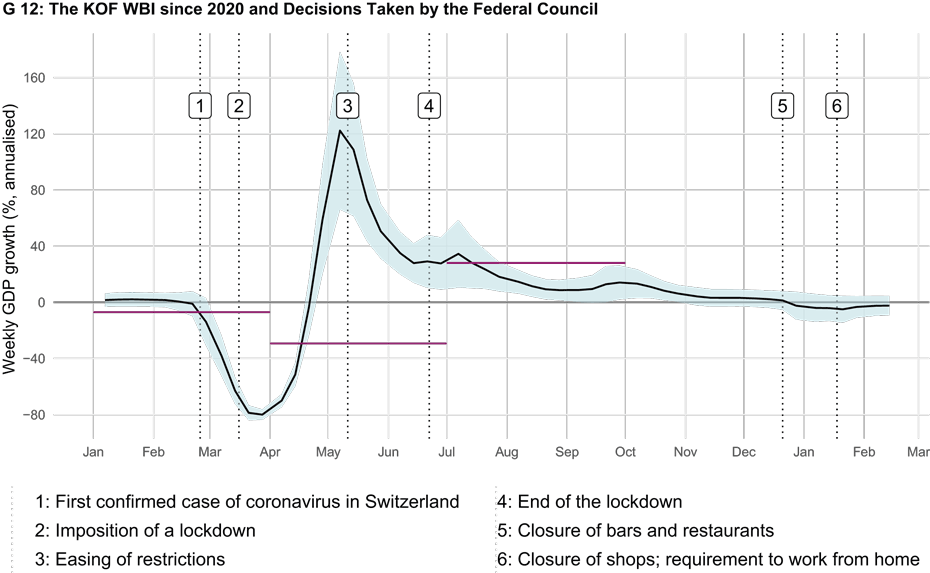
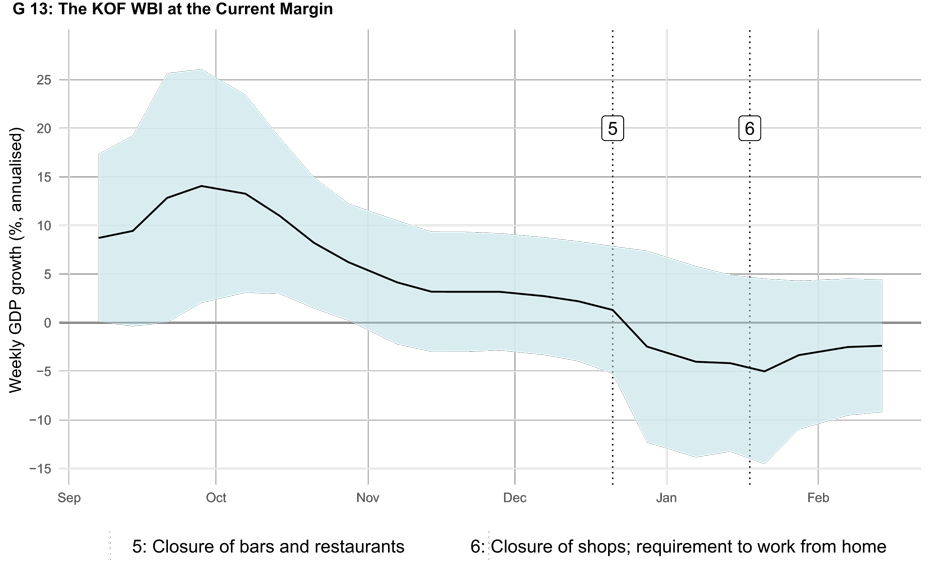
Chart 12 shows the KOF weekly GDP indicator for the coronavirus crisis, together with a 95 per cent confidence interval and the actual quarterly GDP growth rate (annualised). The vertical dashed lines indicate key policy decisions during the pandemic. Restrictions on events and gatherings of people were gradually tightened in late February and early March, and on 16 March the Swiss Federal Council decided to impose a nationwide lockdown. The KOF weekly GDP indicator shows that economic activity had already declined significantly before the lockdown.3 This is because people had already started to reduce their mobility and consumption by the end of February in response to the spread of the pandemic. The lockdown pushed growth rates further into negative territory, bottoming out at the end of March with weekly annualised growth rates of around minus 120 per cent. In April, economic activity continued to contract, albeit at less negative rates. Some shops were allowed to reopen at the end of April, which also enabled economic activity to return to positive growth rates. By mid-May, all other shops and restaurants had reopened and economic activity was recovering at rates similar to the previous slump. With autumn approaching, GDP growth gradually returned to ‘normal’ rates, reaching about 2 per cent in November. The renewed restrictions introduced at the end of December and in mid-January caused growth rates to slow again to as low as minus 4.5 per cent (see G 13). However, there are no signs of a slump as sharp as that in spring 2020. This is because the lockdown is nowhere near as strict, and both the economy and individuals have learned how to deal with the pandemic to a certain extent. Also, fewer sectors of the economy – mainly the hospitality industry and individual service sectors – are currently being affected by these measures. In the other sectors, by contrast, business is currently either stagnating or even improving.4 Overall, however, weekly GDP rates are still falling, albeit at the somewhat slower rate of minus 2.4 per cent. Taken together, the The KOF Weekly GDP Indicator probably points to a slightly positive fourth quarter, followed by a decline in GDP in the first quarter.
We're always wiser in hindsight, aren't we?
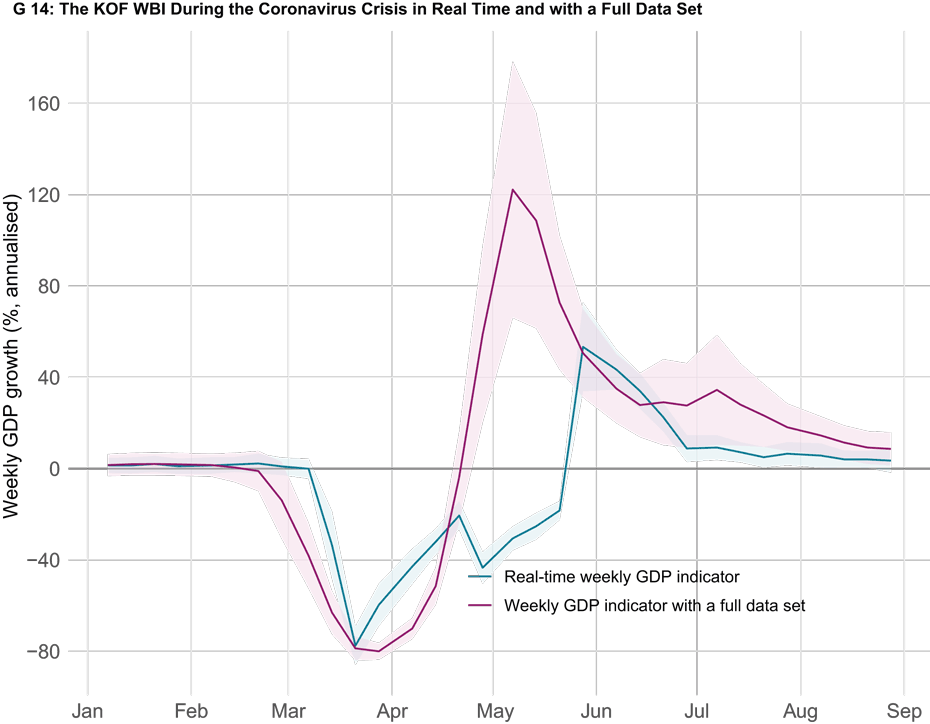
In general, the fact that an indicator explains the business cycle well ex-post is not sufficient evidence that it also works well in real time. The indicator can change constantly at the current margin as new information from subsequent data releases causes revisions. Initial releases rely mainly on readily available alternative data. Traditional indicators such as business tendency surveys and retail sales – which provide more precise signals of changes in GDP over time – as well as GDP itself are published later. This allows potentially false or exaggerated signals from the alternative data to be corrected retrospectively. Chart 14 compares the latest available version of the indicator with the real-time version of the indicator (i.e. the first indicator release in each case). The chart shows that the indicator generally tracked the coronavirus crisis quite well in real time. Nevertheless, the start of the sharp downturn did not materialise until early March rather than at the end of February, as the latest version of the indicator with all available information suggests. Moreover, the real-time version of the indicator shows a slower recovery in April and May, and the extent of both the March trough and the May recovery were also underestimated.
-------------------------------------------------------------------
1) Cf. Eckert, F., Kronenberg, P., Mikosch, H. and S. Neuwirth (2020).
2) The annualised view makes the weekly GDP changes, which can be very small, comparable with more intuitive measures on an annual basis. For example, if a weekly GDP change amounts to 0.1 per cent, the annualised rate is around 5 per cent. This means that, at this rate, GDP would increase by around 5 per cent over a whole year.
3) Cf. Eckert, F. and H. Mikosch (2020).
4) Cf. KOF Business Tendency Surveys.
References
Eckert, F., Mikosch, H.: external page Mobility and sales activity during the Corona crisis: daily indicators for Switzerland. Swiss J Economics Statistics 156, 9 (2020).
Eckert, F., Kronenberg, P., Mikosch, H. and S. Neuwirth: external page Tracking Economic Activity With Alternative High-Frequency Data. KOF Working Papers 488 (2020), KOF Swiss Economic Institute, ETH Zurich.
The latest data on, and indicators of, current economic trends relating to the COVID-19 pandemic can be found here.
Contact
KOF Konjunkturforschungsstelle
Leonhardstrasse 21
8092
Zürich
Switzerland
KOF FB Konjunktur
Leonhardstrasse 21
8092
Zürich
Switzerland
KOF Konjunkturforschungsstelle
Leonhardstrasse 21
8092
Zürich
Switzerland
No database information available